
Meta shares hold above long-term MA-200 support level: weekly report

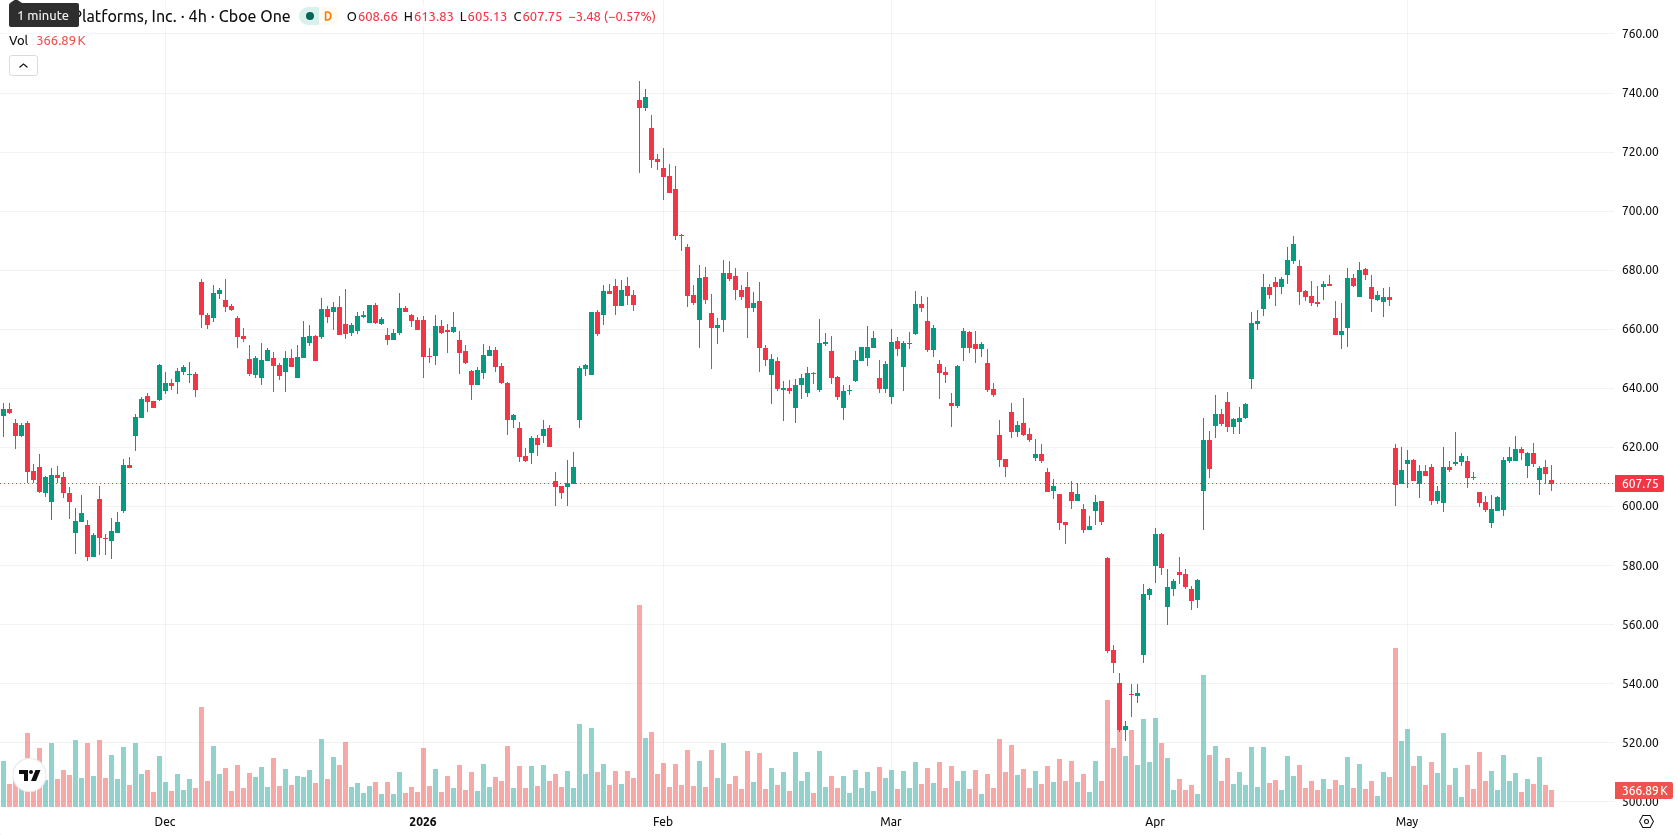
Meta Platforms, Inc. (META, formerly Facebook, Inc.) shares are currently at $605.80, ending the week down $5.62 or 0.64%. The price sits below both the W1 MA-20 at $632.03 and MA-50 at $674.10, but remains well above the long-term MA-200 at $456.28, indicating medium-term selling pressure with longer-term support still intact.
Highlights
- Meta stock is experiencing medium-term selling pressure while maintaining a bullish long-term trend above major support levels.
- Technical indicators confirm prevailing bearish momentum, with weak trend direction and sellers dominating the current trading environment.
- Expected trading range for the coming week is $602 to $639, with a higher probability of sideways or downside movement barring a reversal above resistance.
Workforce cuts and AI pivot shape sentiment amid capital spending plans
Meta announced a major restructuring initiative with plans to lay off around 8,000 employees globally, starting May 20, which is approximately 10% of its workforce. Approximately 7,000 staff will be reassigned to roles supporting the company’s acceleration in artificial intelligence, as Meta seeks to streamline operations with a focus on AI development. These moves are part of a broader effort to manage a projected capital expenditure budget between $125 billion and $145 billion for the year, mainly allocated to AI infrastructure.
Sustained bearish momentum as technical signals favor sellers this week
On the weekly chart, Meta remains under its MA-20 and MA-50, signaling an ongoing bearish trend, but is still well above the MA-200, which provides longer-term support. Key weekly support is found near $602, with resistance at $639. The RSI stands at 46.28 and CCI at -53.46, both pointing to neutral-to-bearish momentum, while the weekly Stochastic RSI also sits at a neutral level. Momentum indicators such as the MACD (strong sell signal), ADX (12.52, indicating a lack of trend), and negative Bull/Bear Power confirm sellers remain in control, and the asset is in the lower part of its weekly range with volatility at 4.54%.
Rangebound outlook as consolidation persists without bullish technical confirmation
For the next five trading days, Meta is expected to trade within a range of $602 to $639, in line with current volatility. A sideways consolidation is the most likely scenario, as none of the four key weekly indicators support a bullish reversal. A break above $639 would be required for any rebound, while a drop below $602 could open the door to further declines if bearish momentum persists.
Earlier, analysts noted that Meta was experiencing persistent bearish momentum and operational uncertainty due to workforce reductions and a shift toward AI-driven restructuring. The latest developments reinforce this cautious outlook, as ongoing selling pressure and neutral-to-bearish momentum indicators point to consolidation as the prevailing scenario, with $639 remaining a critical resistance level to monitor for any potential rebound.


-
 Afghanistan
-
 Albania
-
 Algeria
-
 Angola
-
 Argentina
-
 Armenia
-
 Australia
-
 Austria
-
 Azerbaijan
-
 Bahamas
-
 Bahrain
-
 Bangladesh
-
 Belarus
-
 Belgium
-
 Bolivia
-
 Botswana
-
 Brazil
-
 Brunei
-
 Bulgaria
-
 Cambodia
-
 Cameroon
-
 Canada
-
 Chile
Chile
-
 China
China
-
 Colombia
-
 Congo
Congo
-
 Costa Rica
-
 Cote d'Ivoire
-
 Croatia
-
 Cuba
Cuba
-
 Cyprus
-
 Czechia
-
 DR Congo
-
 Denmark
-
 Dominican Republic
-
 Ecuador
-
 Egypt
Egypt
-
 El Salvador
-
 Estonia
-
 Eswatini
-
 Ethiopia
-
 Finland
-
 France
-
 Georgia
-
 Germany
-
 Ghana
Ghana
-
 Greece
-
 Haiti
Haiti
-
 Hong Kong
-
 Hungary
-
 India
India
-
 Indonesia
-
 Iran, Islamic republic
-
 Iraq
Iraq
-
 Ireland
-
 Israel
-
 Italy
Italy
-
 Jamaica
-
 Japan
Japan
-
 Jordan
-
 Kazakhstan
-
 Kenya
Kenya
-
 Korea
Korea
-
 Kuwait
-
 Kyrgyzstan
-
 Laos
Laos
-
 Latvia
-
 Lebanon
-
 Lesotho
-
 Libya
Libya
-
 Lithuania
-
 Luxembourg
-
 Madagascar
-
 Malaysia
-
 Malta
Malta
-
 Mauritius
-
 Mexico
-
 Moldova
-
 Mongolia
-
 Montenegro
-
 Morocco
-
 Mozambique
-
 Myanmar
-
 Namibia
-
 Nepal
Nepal
-
 Netherlands
-
 New Zealand
-
 Nigeria
-
 North Macedonia
-
 Norway
-
 Oman
Oman
-
 Pakistan
-
 Palestine
-
 Panama
-
 Papua New Guinea
-
 Paraguay
-
 Peru
Peru
-
 Philippines
-
 Poland
-
 Portugal
-
 Puerto Rico
-
 Qatar
Qatar
-
 Reunion
-
 Romania
-
 Rwanda
-
 Saudi Arabia
-
 Serbia
-
 Singapore
-
 Slovakia
-
 Slovenia
-
 Somalia
-
 South Africa
-
 Spain
Spain
-
 Sri Lanka
-
 Sweden
-
 Switzerland
-
 Syria
Syria
-
 Taiwan
-
 Tajikistan
-
 Tanzania
-
 Thailand
-
 Trinidad and Tobago
-
 Tunisia
-
 Turkey
-
 UAE
UAE
-
 Uganda
-
 Ukraine
-
 United Kingdom
-
United States
-
 Uruguay
-
 Uzbekistan
-
 Venezuela
-
 Vietnam
-
 Yemen
Yemen
-
 Zambia
-
 Zimbabwe
- Forex
- Crypto
