
AI-driven restructuring drives Intuit stock down 3.45% in Thursday trading

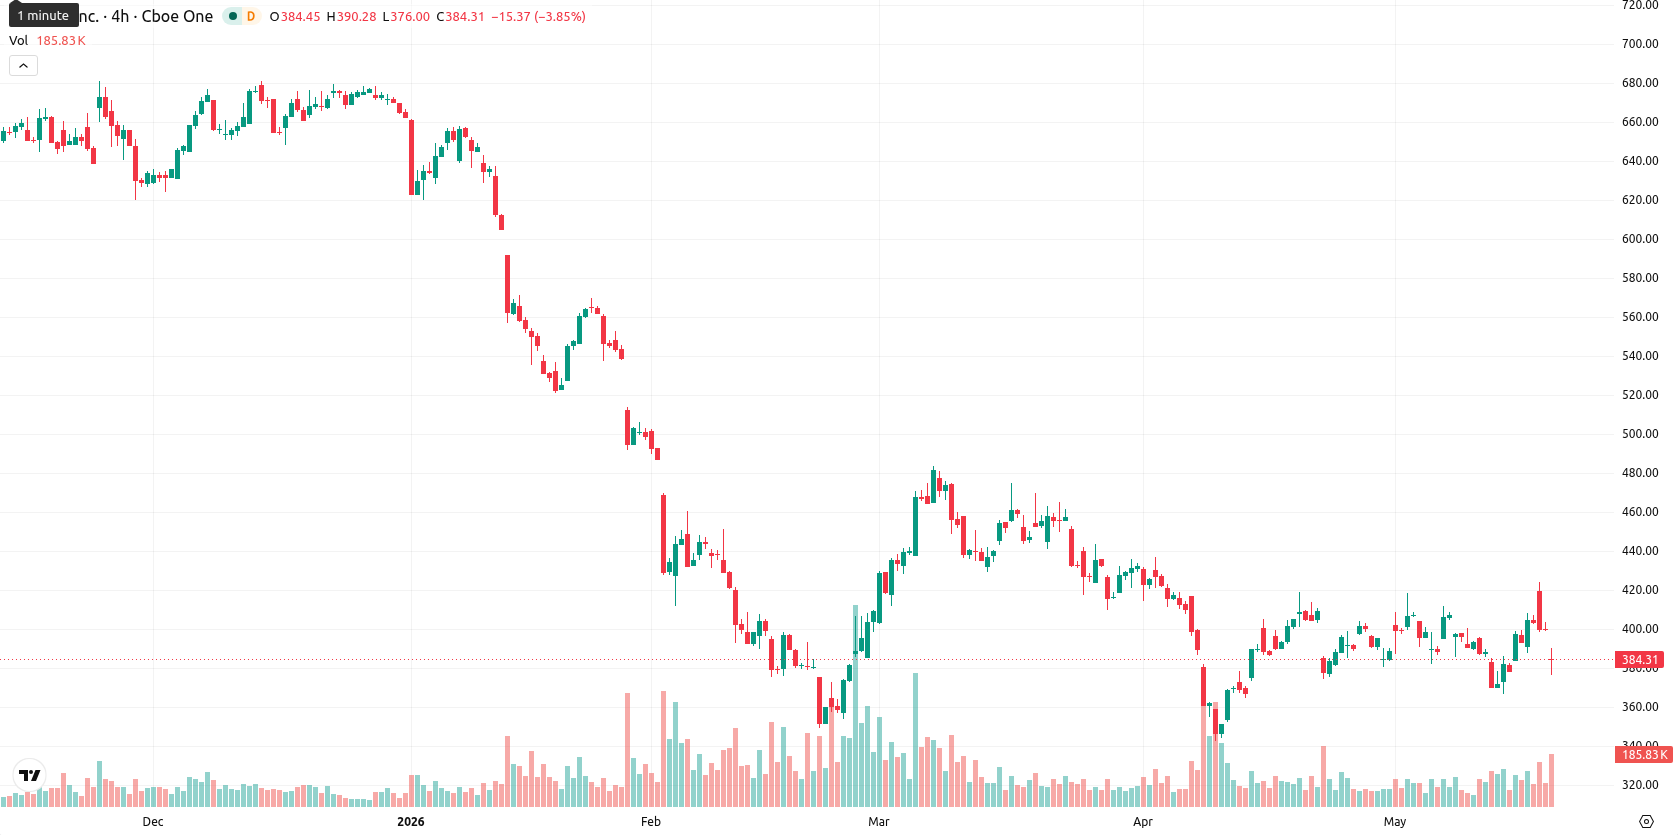
Intuit Inc. (INTU) is trading at $385.79 following a one-day loss of $13.79, which equates to a decline of 3.45%. The asset remains below its key moving averages, indicating a continuation of short-term price pressure.
Highlights
- Intuit is laying off about 3,000 employees, or 17% of its workforce, to accelerate a strategic shift toward AI-focused operations.
- The restructuring follows Q2 2026 earnings with EPS at $4.15 and revenue of $4.65 billion, amid ongoing share price pressure.
- Shares are trading below key moving averages with technical indicators signaling persistent bearish momentum and a probable trading range of $375–$400 in the coming week.
Workforce cuts and AI transition as management seeks efficiency gains
Intuit has announced a significant operational restructuring, with approximately 3,000 employees, or 17% of its global workforce, being laid off across seven countries. The company's management stated that the reduction aims to streamline operations and accelerate a shift toward artificial intelligence-driven initiatives, supported by newly signed multi-year partnerships with Anthropic and OpenAI. These developments follow a period in which Intuit reported Q2 2026 earnings per share of $4.15 and revenue of $4.65 billion, framing the current strategic pivot and sizable workforce reduction as a move to boost efficiency and product capabilities, though price action has remained under broader selling pressure.
Bearish momentum and weak trend as technical barriers intensify
Price is now trading below key technical levels: SMA-20 ($394.13), SMA-50 ($408.86), and SMA-200 ($565.65). The Ichimoku Kijun on the daily chart is located at $391.67 and currently acts as immediate resistance. Momentum indicators on the daily timeframe show a bearish setup, as the MACD presents a strong sell signal and the ADX remains low, indicating weak trend strength. The RSI stands neutral at 51, while both the Stoch RSI and CCI are in overbought territory, highlighting recent but likely unsustainable rebound attempts. Bull/Bear Power (BBP) on D1 points to persistent buyer dominance, yet intraday readings confirm sellers are currently in control. The gap-down opening and trading near the session’s low reflect high volatility and unresolved directional momentum amid mixed oscillator signals.
Range-bound movement likely as downward signals dominate short-term outlook
In the short term, price action for INTU is expected to fluctuate within a $375 to $400 range, representing a typical volatility band relative to current levels. The probability of a sustained upward move remains low, with persistent bearish signals across multiple daily and weekly technical indicators. The baseline scenario is for consolidation and sideways movement following the sharp decline. A bullish shift would require a breakout above the $391.67 resistance, with continued strength above $400. Conversely, if the price drops below $375, there is potential for further downside momentum.
Earlier, analysts noted that Intuit’s stock was experiencing persistent downward pressure amid technical challenges and a strategic pivot toward AI-driven growth. The latest operational restructuring and continued selloff reinforce the prevailing consolidation scenario, making a sustained move above immediate resistance a key signal for any potential trend reversal.


-
 Afghanistan
-
 Albania
-
 Algeria
-
 Angola
-
 Argentina
-
 Armenia
-
 Australia
-
 Austria
-
 Azerbaijan
-
 Bahamas
-
 Bahrain
-
 Bangladesh
-
 Belarus
-
 Belgium
-
 Bolivia
-
 Botswana
-
 Brazil
-
 Brunei
-
 Bulgaria
-
 Cambodia
-
 Cameroon
-
 Canada
-
 Chile
Chile
-
 China
China
-
 Colombia
-
 Congo
Congo
-
 Costa Rica
-
 Cote d'Ivoire
-
 Croatia
-
 Cuba
Cuba
-
 Cyprus
-
 Czechia
-
 DR Congo
-
 Denmark
-
 Dominican Republic
-
 Ecuador
-
 Egypt
Egypt
-
 El Salvador
-
 Estonia
-
 Eswatini
-
 Ethiopia
-
 Finland
-
 France
-
 Georgia
-
 Germany
-
 Ghana
Ghana
-
 Greece
-
 Haiti
Haiti
-
 Hong Kong
-
 Hungary
-
 India
India
-
 Indonesia
-
 Iran, Islamic republic
-
 Iraq
Iraq
-
 Ireland
-
 Israel
-
 Italy
Italy
-
 Jamaica
-
 Japan
Japan
-
 Jordan
-
 Kazakhstan
-
 Kenya
Kenya
-
 Korea
Korea
-
 Kuwait
-
 Kyrgyzstan
-
 Laos
Laos
-
 Latvia
-
 Lebanon
-
 Lesotho
-
 Libya
Libya
-
 Lithuania
-
 Luxembourg
-
 Madagascar
-
 Malaysia
-
 Malta
Malta
-
 Mauritius
-
 Mexico
-
 Moldova
-
 Mongolia
-
 Montenegro
-
 Morocco
-
 Mozambique
-
 Myanmar
-
 Namibia
-
 Nepal
Nepal
-
 Netherlands
-
 New Zealand
-
 Nigeria
-
 North Macedonia
-
 Norway
-
 Oman
Oman
-
 Pakistan
-
 Palestine
-
 Panama
-
 Papua New Guinea
-
 Paraguay
-
 Peru
Peru
-
 Philippines
-
 Poland
-
 Portugal
-
 Puerto Rico
-
 Qatar
Qatar
-
 Reunion
-
 Romania
-
 Rwanda
-
 Saudi Arabia
-
 Serbia
-
 Singapore
-
 Slovakia
-
 Slovenia
-
 Somalia
-
 South Africa
-
 Spain
Spain
-
 Sri Lanka
-
 Sweden
-
 Switzerland
-
 Syria
Syria
-
 Taiwan
-
 Tajikistan
-
 Tanzania
-
 Thailand
-
 Trinidad and Tobago
-
 Tunisia
-
 Turkey
-
 UAE
UAE
-
 Uganda
-
 Ukraine
-
 United Kingdom
-
United States
-
 Uruguay
-
 Uzbekistan
-
 Venezuela
-
 Vietnam
-
 Yemen
Yemen
-
 Zambia
-
 Zimbabwe
- Forex
- Crypto
