

Costco stock slides as shares test support near $999 with mixed technical signals: weekly outlook

Costco Wholesale Corporation (COST) is currently priced at $1,003.54, posting a weekly decline of $24.40 (2.26%). The stock sits just above the weekly MA-20 ($999.46), above the MA-50 ($959.45), and remains well above the MA-200 ($766.57), reinforcing a medium- to long-term bullish bias even as it tests support at the bottom of the week’s range.
 966.00
966.00
966.00
Highlights
- Costco trades near key support at $1,003.54 after a 2.26% weekly decline, signaling a consolidation phase.
- Technical indicators present mixed momentum, with MACD and RSI bullish but oscillators showing oversold levels and neutral trend strength.
- Forecast for the next week shows a likely sideways range between $1,000.80 and $1,017.44, with balanced upside and downside risk.
Earnings outlook and membership gains drive sentiment despite legal risk
Costco is set to release its fiscal Q3 2026 earnings after the market closes on May 28, 2026, with analysts expecting earnings per share of $4.98 and revenue near $69.61 billion. Recent performance has been supported by strong membership growth, notable increases in membership fee income, and robust comparable sales. Secondary developments include a slight reduction in institutional holdings and the filing of a new lawsuit over California’s auto-renewal law.
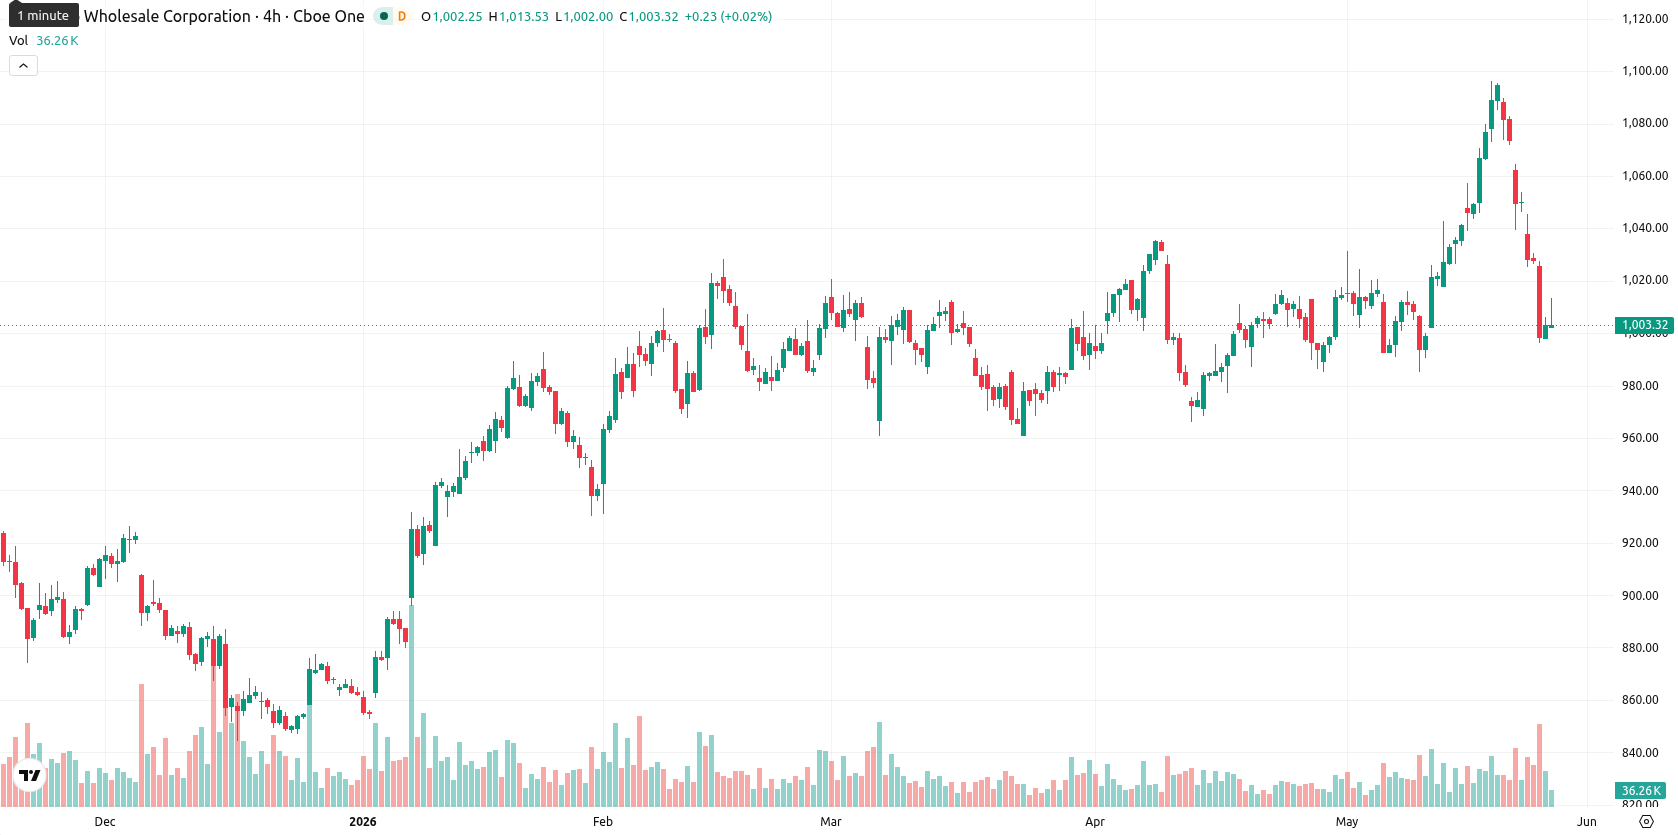
Technical divergence grows as price hovers near weekly support
On the weekly chart, Costco is hovering just above the MA-20 and MA-50, with long-term support maintained above the MA-200. Support is established at $999.46 (MA-20) and $959.45 (MA-50), while resistance is seen around $1,017.44. Weekly volatility registered at 6.88%. Momentum signals are mixed: the MACD and RSI lean bullish, but the ADX is neutral, and the Stochastic RSI signals oversold conditions. Bull/Bear Power suggests buyers remain engaged, while the Awesome Oscillator presents a neutral view, pointing to a divergent technical landscape and a potential inflection point as price holds near support.
Sideways bias expected amid balanced signals and breakout risk next week
Over the next five trading days, Costco is expected to trade between $1,000.80 and $1,017.44, averaging near $1,009.12. With 2 out of 4 major weekly indicators signaling Buy or Strong Buy, there is about a 50% chance of upward or downward movement. The baseline scenario envisions sideways consolidation, confined within current support and resistance. An upward breakout could see the price test levels above $1,017.44, while a drop below $1,000.80 could trigger a retest of deeper support.
Earlier, analysts noted that Costco shares faced short-term uncertainty within a broadly constructive long-term trend, with market participants awaiting new catalysts around upcoming earnings. With momentum signals remaining mixed and the stock at a technical inflection point, traders should watch for a decisive move above $1,017.44 or below $1,000.80 to signal the next directional breakout.











-
 Afghanistan
-
 Albania
-
 Algeria
-
 Angola
-
 Argentina
-
 Armenia
-
 Australia
-
 Austria
-
 Azerbaijan
-
 Bahamas
-
 Bahrain
-
 Bangladesh
-
 Belarus
-
 Belgium
-
 Bolivia
-
 Botswana
-
 Brazil
-
 Brunei
-
 Bulgaria
-
 Cambodia
-
 Cameroon
-
 Canada
-
 Chile
Chile
-
 China
China
-
 Colombia
-
 Congo
Congo
-
 Costa Rica
-
 Cote d'Ivoire
-
 Croatia
-
 Cuba
Cuba
-
 Cyprus
-
 Czechia
-
 DR Congo
-
 Denmark
-
 Dominican Republic
-
 Ecuador
-
 Egypt
Egypt
-
 El Salvador
-
 Estonia
-
 Eswatini
-
 Ethiopia
-
 Finland
-
 France
-
 Georgia
-
 Germany
-
 Ghana
Ghana
-
 Greece
-
 Haiti
Haiti
-
 Hong Kong
-
 Hungary
-
 India
India
-
 Indonesia
-
 Iran, Islamic republic
-
 Iraq
Iraq
-
 Ireland
-
 Israel
-
 Italy
Italy
-
 Jamaica
-
 Japan
Japan
-
 Jordan
-
 Kazakhstan
-
 Kenya
Kenya
-
 Korea
Korea
-
 Kuwait
-
 Kyrgyzstan
-
 Laos
Laos
-
 Latvia
-
 Lebanon
-
 Lesotho
-
 Libya
Libya
-
 Lithuania
-
 Luxembourg
-
 Madagascar
-
 Malaysia
-
 Malta
Malta
-
 Mauritius
-
 Mexico
-
 Moldova
-
 Mongolia
-
 Montenegro
-
 Morocco
-
 Mozambique
-
 Myanmar
-
 Namibia
-
 Nepal
Nepal
-
 Netherlands
-
 New Zealand
-
 Nigeria
-
 North Macedonia
-
 Norway
-
 Oman
Oman
-
 Pakistan
-
 Palestine
-
 Panama
-
 Papua New Guinea
-
 Paraguay
-
 Peru
Peru
-
 Philippines
-
 Poland
-
 Portugal
-
 Puerto Rico
-
 Qatar
Qatar
-
 Reunion
-
 Romania
-
 Rwanda
-
 Saudi Arabia
-
 Serbia
-
 Singapore
-
 Slovakia
-
 Slovenia
-
 Somalia
-
 South Africa
-
 Spain
Spain
-
 Sri Lanka
-
 Sweden
-
 Switzerland
-
 Syria
Syria
-
 Taiwan
-
 Tajikistan
-
 Tanzania
-
 Thailand
-
 Trinidad and Tobago
-
 Tunisia
-
 Turkey
-
 UAE
UAE
-
 Uganda
-
 Ukraine
-
 United Kingdom
-
United States
-
 Uruguay
-
 Uzbekistan
-
 Venezuela
-
 Vietnam
-
 Yemen
Yemen
-
 Zambia
-
 Zimbabwe
- Forex
- Crypto












