
Interactive Brokers stock falls as buyers show strength near $76 support

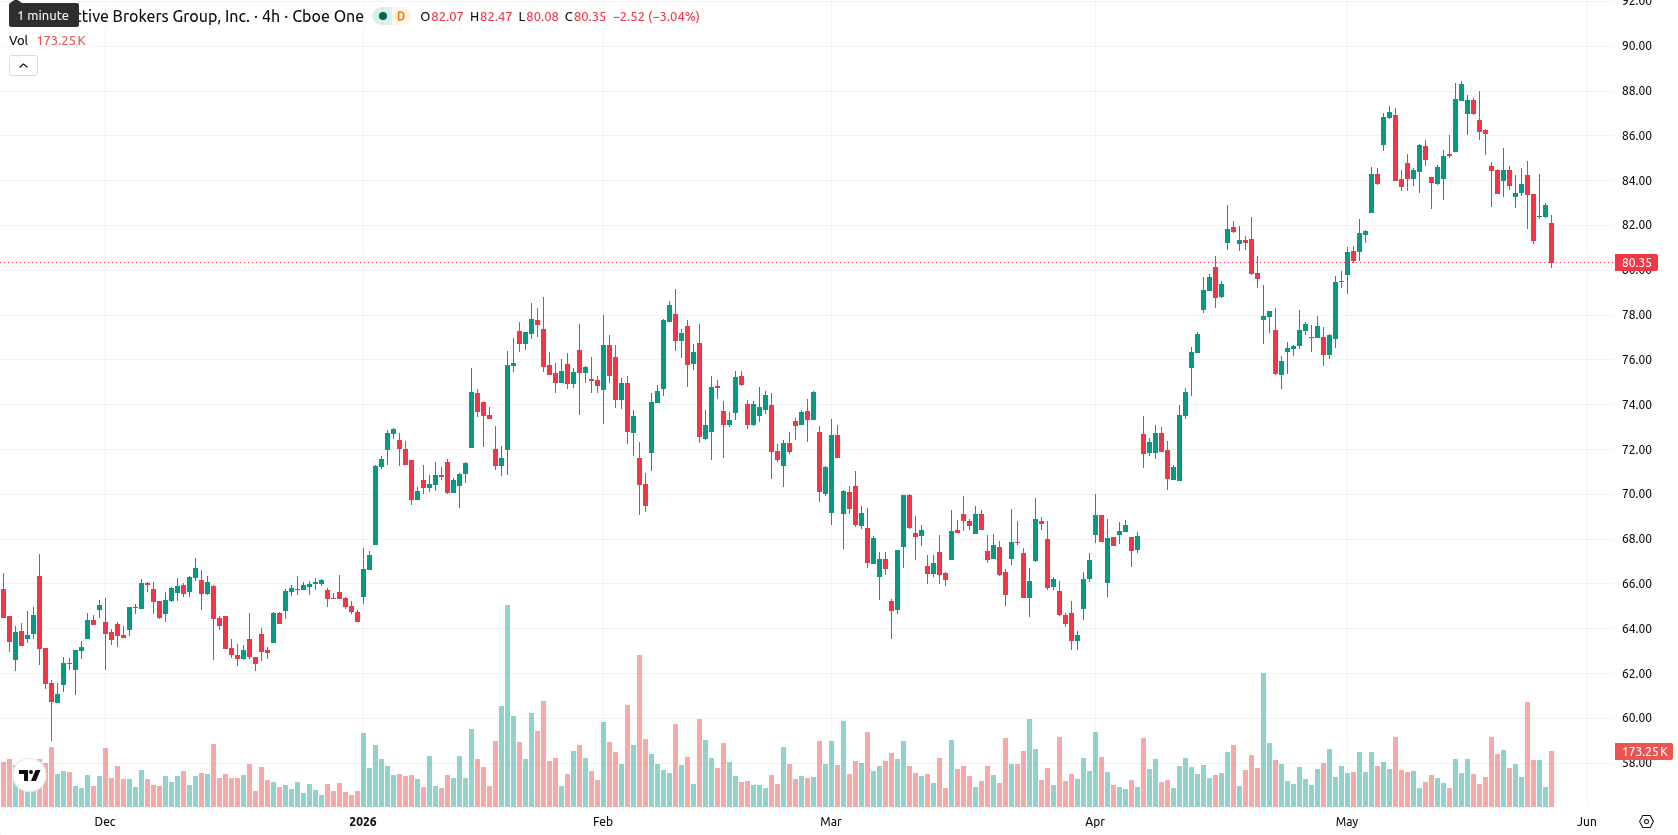
Interactive Brokers Group, Inc. (IBKR) stock is trading at $80.27, marking a daily decline of 3.17%. The price currently sits below its key short-term moving averages while maintaining position above medium- and long-term trend levels.
Highlights
- Interactive Brokers' TWS API 10.47 update enhances platform flexibility and automation capabilities, potentially supporting future client retention.
- This incremental software improvement is not expected to materially affect near-term trading volumes or share valuation amid ongoing broad market selling pressure.
- Technicals indicate short-term selling pressure with price consolidating between $79.87 and $82.29, while mixed momentum signals suggest a high probability of a rebound in the next five sessions.
API upgrade seen as limited catalyst amid persistent selling pressure
Interactive Brokers released version 10.47 of its Trader Workstation (TWS) API, reflecting ongoing efforts to improve its core trading platform. The introduction of enhanced API features may expand functionality and operational flexibility for brokerage clients, potentially supporting future user retention or workflow automation. However, this type of incremental software update typically has limited short-term impact on trading volume or valuation, and price action has remained under broader selling pressure.
Resistance at Kijun and bullish momentum signal oversold rebound risk
Technically, IBKR is trading below the SMA-20 at $83.33, above the SMA-50 at $76.37, and well above the SMA-200 at $70.08. The Ichimoku Kijun level stands at $81.53, serving as the closest resistance point directly above the current price. In terms of momentum, the MACD and ADX (D1) indicate underlying bullish sentiment, though the daily RSI remains moderately positive while the Stoch RSI and CCI both suggest oversold conditions, hinting at a potential rebound. BBP is elevated at 0.72, highlighting recent buyer dominance despite today’s price drop, which included a minor gap down at the open and positioning near session lows after moderate volatility.
High upside probability as consolidation holds above key support
Looking ahead over the next five sessions, the anticipated trading range for IBKR is $79.87 to $82.29, representing a typical volatility band relative to current levels. There is a high probability (above 80%) of a price increase, with a short-term pullback scenario considered less likely. The baseline outlook is for consolidation between $79.87 and $82.29, though a breakout above resistance at $81.53 could prompt a move toward the weekly high near $82.29. If the $79.87 support level fails, further downside could develop, though substantial longer-term support persists above $76.
Earlier, analysts noted that despite short-term weakness, Interactive Brokers maintained a constructive medium- and long-term technical backdrop. The latest developments—both in platform enhancements and current technical readings—reinforce the robust underlying momentum, making the $81.53 resistance level a pivotal threshold for traders monitoring the next decisive move.


Latest Interactive Brokers News


-
 Afghanistan
-
 Albania
-
 Algeria
-
 Angola
-
 Argentina
-
 Armenia
-
 Australia
-
 Austria
-
 Azerbaijan
-
 Bahamas
-
 Bahrain
-
 Bangladesh
-
 Belarus
-
 Belgium
-
 Bolivia
-
 Botswana
-
 Brazil
-
 Brunei
-
 Bulgaria
-
 Cambodia
-
 Cameroon
-
 Canada
-
 Chile
Chile
-
 China
China
-
 Colombia
-
 Congo
Congo
-
 Costa Rica
-
 Cote d'Ivoire
-
 Croatia
-
 Cuba
Cuba
-
 Cyprus
-
 Czechia
-
 DR Congo
-
 Denmark
-
 Dominican Republic
-
 Ecuador
-
 Egypt
Egypt
-
 El Salvador
-
 Estonia
-
 Eswatini
-
 Ethiopia
-
 Finland
-
 France
-
 Georgia
-
 Germany
-
 Ghana
Ghana
-
 Greece
-
 Haiti
Haiti
-
 Hong Kong
-
 Hungary
-
 India
India
-
 Indonesia
-
 Iran, Islamic republic
-
 Iraq
Iraq
-
 Ireland
-
 Israel
-
 Italy
Italy
-
 Jamaica
-
 Japan
Japan
-
 Jordan
-
 Kazakhstan
-
 Kenya
Kenya
-
 Korea
Korea
-
 Kuwait
-
 Kyrgyzstan
-
 Laos
Laos
-
 Latvia
-
 Lebanon
-
 Lesotho
-
 Libya
Libya
-
 Lithuania
-
 Luxembourg
-
 Madagascar
-
 Malaysia
-
 Malta
Malta
-
 Mauritius
-
 Mexico
-
 Moldova
-
 Mongolia
-
 Montenegro
-
 Morocco
-
 Mozambique
-
 Myanmar
-
 Namibia
-
 Nepal
Nepal
-
 Netherlands
-
 New Zealand
-
 Nigeria
-
 North Macedonia
-
 Norway
-
 Oman
Oman
-
 Pakistan
-
 Palestine
-
 Panama
-
 Papua New Guinea
-
 Paraguay
-
 Peru
Peru
-
 Philippines
-
 Poland
-
 Portugal
-
 Puerto Rico
-
 Qatar
Qatar
-
 Reunion
-
 Romania
-
 Rwanda
-
 Saudi Arabia
-
 Serbia
-
 Singapore
-
 Slovakia
-
 Slovenia
-
 Somalia
-
 South Africa
-
 Spain
Spain
-
 Sri Lanka
-
 Sweden
-
 Switzerland
-
 Syria
Syria
-
 Taiwan
-
 Tajikistan
-
 Tanzania
-
 Thailand
-
 Trinidad and Tobago
-
 Tunisia
-
 Turkey
-
 UAE
UAE
-
 Uganda
-
 Ukraine
-
 United Kingdom
-
United States
-
 Uruguay
-
 Uzbekistan
-
 Venezuela
-
 Vietnam
-
 Yemen
Yemen
-
 Zambia
-
 Zimbabwe
- Forex
- Crypto
