
Nvidia stock edges lower after US-China semiconductor trade tensions escalate

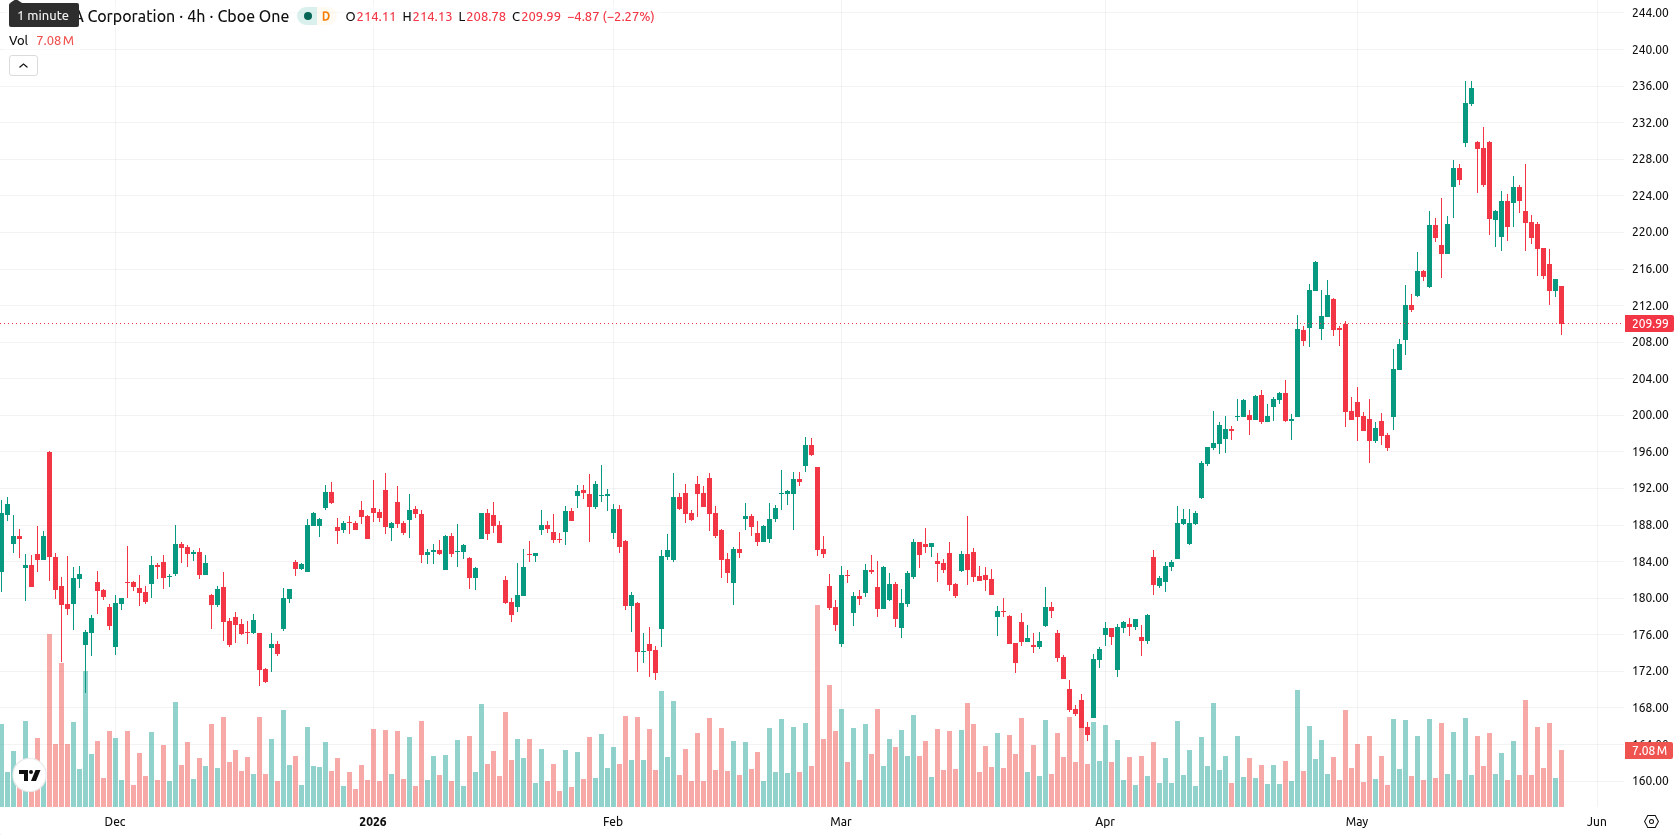
Nvidia (NVDA) stock is trading at $210.11, down 2.13% on the day. The price currently sits below its key short-term moving averages but remains above both its medium- and long-term averages.
 198.69
214.39
198.69
214.39
Highlights
- Authorities in Taiwan uncovered a smuggling ring moving Nvidia chips into China, increasing regulatory and enforcement risks around export controls.
- Nvidia’s $150 billion annual exposure in Taiwan heightens its vulnerability to further geopolitical or supply chain disruptions amid deepening US-China tensions.
- Nvidia trades below short-term resistance with sellers dominating intraday action, but the medium- and long-term trend remains bullish with a projected range of $209.55 to $215.35 for the next week.
Risks to supply chain rise amid chip smuggling and regulatory scrutiny
On May 27, Taiwan prosecutors confirmed the discovery of a criminal operation smuggling Nvidia chips into China, bypassing export controls and raising the likelihood of further regulatory enforcement targeting the company’s products. Escalating geopolitical tensions in the semiconductor sector now increase the probability of additional government-imposed bans or tighter cross-border restrictions impacting Nvidia’s supply chain and sales channels. Furthermore, Nvidia’s annual commitment of approximately $150 billion in Taiwan further amplifies the company’s exposure to these geopolitical dynamics and potential disruptions.
Weak trend and seller control as resistance holds and volatility builds
On the technical front, NVDA faces immediate resistance at the SMA-20 ($214.61) and Ichimoku Kijun ($215.64), while support levels are found at the SMA-50 ($197.48) and SMA-200 ($187.19). Momentum measures are mixed: the daily MACD indicates strong upward momentum but the daily ADX signals a weak overall trend; the RSI on the daily chart is neutral-to-bullish, while Stoch RSI and Bull/Bear Power (BBP) flag oversold conditions and CCI is neutral. BBP's negative reading alongside a neutral Awesome Oscillator highlights seller control in intraday trading, with price closing near session lows, moderately elevated volatility, and a risk-off market tone.
Consolidation expected as bullish structure supports rebound scenario
Over the next five trading days, the expected volatility band is $209.55 to $215.35. A price rebound is likely given that at least three out of four major weekly trend indicators still support a bullish outlook. The baseline expectation is for NVDA to consolidate between $209.55 and $215.35. A move above $215.64 could initiate a rally toward the upper end of the range, while a drop below $209.55 may see prices extend lower near short-term support, with medium- and long-term bullish structures remaining intact.
Earlier, analysts noted that Nvidia was experiencing short-term selling pressure despite underlying strength in its medium- and long-term trends. The emergence of significant regulatory and geopolitical risks now introduces a new layer of uncertainty, making a decisive break above or below the current $209.55–$215.35 consolidation band a trigger for the next directional move.


Latest NVDA News







-
 Afghanistan
-
 Albania
-
 Algeria
-
 Angola
-
 Argentina
-
 Armenia
-
 Australia
-
 Austria
-
 Azerbaijan
-
 Bahamas
-
 Bahrain
-
 Bangladesh
-
 Belarus
-
 Belgium
-
 Bolivia
-
 Botswana
-
 Brazil
-
 Brunei
-
 Bulgaria
-
 Cambodia
-
 Cameroon
-
 Canada
-
 Chile
Chile
-
 China
China
-
 Colombia
-
 Congo
Congo
-
 Costa Rica
-
 Cote d'Ivoire
-
 Croatia
-
 Cuba
Cuba
-
 Cyprus
-
 Czechia
-
 DR Congo
-
 Denmark
-
 Dominican Republic
-
 Ecuador
-
 Egypt
Egypt
-
 El Salvador
-
 Estonia
-
 Eswatini
-
 Ethiopia
-
 Finland
-
 France
-
 Georgia
-
 Germany
-
 Ghana
Ghana
-
 Greece
-
 Haiti
Haiti
-
 Hong Kong
-
 Hungary
-
 India
India
-
 Indonesia
-
 Iran, Islamic republic
-
 Iraq
Iraq
-
 Ireland
-
 Israel
-
 Italy
Italy
-
 Jamaica
-
 Japan
Japan
-
 Jordan
-
 Kazakhstan
-
 Kenya
Kenya
-
 Korea
Korea
-
 Kuwait
-
 Kyrgyzstan
-
 Laos
Laos
-
 Latvia
-
 Lebanon
-
 Lesotho
-
 Libya
Libya
-
 Lithuania
-
 Luxembourg
-
 Madagascar
-
 Malaysia
-
 Malta
Malta
-
 Mauritius
-
 Mexico
-
 Moldova
-
 Mongolia
-
 Montenegro
-
 Morocco
-
 Mozambique
-
 Myanmar
-
 Namibia
-
 Nepal
Nepal
-
 Netherlands
-
 New Zealand
-
 Nigeria
-
 North Macedonia
-
 Norway
-
 Oman
Oman
-
 Pakistan
-
 Palestine
-
 Panama
-
 Papua New Guinea
-
 Paraguay
-
 Peru
Peru
-
 Philippines
-
 Poland
-
 Portugal
-
 Puerto Rico
-
 Qatar
Qatar
-
 Reunion
-
 Romania
-
 Rwanda
-
 Saudi Arabia
-
 Serbia
-
 Singapore
-
 Slovakia
-
 Slovenia
-
 Somalia
-
 South Africa
-
 Spain
Spain
-
 Sri Lanka
-
 Sweden
-
 Switzerland
-
 Syria
Syria
-
 Taiwan
-
 Tajikistan
-
 Tanzania
-
 Thailand
-
 Trinidad and Tobago
-
 Tunisia
-
 Turkey
-
 UAE
UAE
-
 Uganda
-
 Ukraine
-
 United Kingdom
-
United States
-
 Uruguay
-
 Uzbekistan
-
 Venezuela
-
 Vietnam
-
 Yemen
Yemen
-
 Zambia
-
 Zimbabwe
- Forex
- Crypto












