
Intuit stock gains 4.99% as analytics AI launch expands product suite

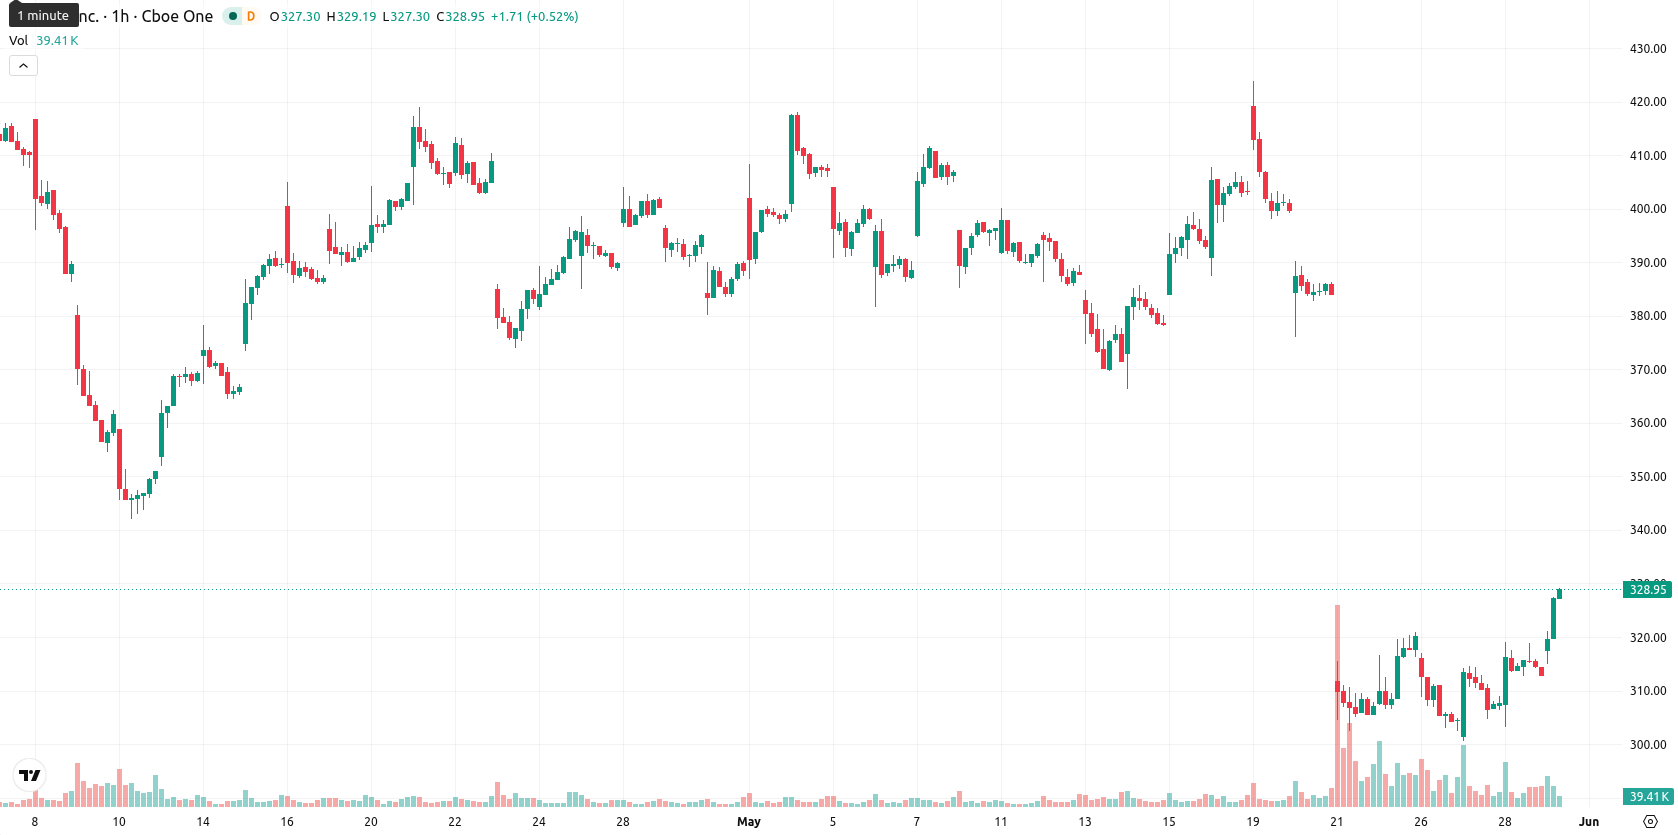
Intuit Inc. (INTU) stock is trading at $329.33 after advancing 4.99% on the day. The price remains below its key moving averages, reflecting upward momentum in today's session despite broader short- to long-term bearish pressure.
Highlights
- Intuit introduced Analytics AI for Mailchimp and expanded AI features, strengthening core product differentiation and utility for small businesses.
- The company announced a 17% workforce reduction and achieved strong Q3 earnings with EPS of $12.80 and revenue of $8.56 billion, supporting margin and global expansion efforts.
- INTU trades under key moving averages with weak momentum, likely remaining within the $311.00–$333.00 range as bearish pressure persists.
AI expansion and cost cuts boost interest as earnings outperform
Intuit's launch of Analytics AI, a new conversational analytics agent for Mailchimp, along with expanded AI-driven features for small business clients, is driving fresh interest by enhancing the utility and differentiation of its core products. The company's recent 17% workforce reduction, involving around 3,000 employees, marks a significant cost realignment as it accelerates generative AI integration across its platforms, potentially improving operational efficiencies and margin outlook. Strong Q3 results, with EPS of $12.80 surpassing consensus and revenue rising to $8.56 billion, further support Intuit's financial foundation as it expands its global business and online ecosystem franchises.
Technical resistance weighs as momentum and oscillators signal oversold
Technically, INTU is trading below the SMA-20 at $372.38, SMA-50 at $393.97, and SMA-200 at $552.58, confirming resistance at each level. The Ichimoku Kijun on the daily chart stands at $362.25, pinpointing immediate overhead resistance. Momentum indicators show mixed signals: MACD and ADX indicate weak or negative momentum, while oscillators such as the RSI at 33.87, CCI at –129.36, and Stoch RSI at 22.39 all place INTU in or near oversold territory. Bull/Bear Power (BBP) also marks oversold conditions with sellers largely dominating, and the intraday Awesome Oscillator remains negative, providing little evidence of an imminent reversal.
Range-bound outlook as rebound odds remain low
In the short term, INTU is expected to fluctuate within a $311.00–$333.00 volatility band relative to current levels. The probability of a near-term rebound remains limited, with less than a 20% statistical likelihood for immediate upside. If INTU breaks above $333.00, short-term covering could push prices toward the $340.00 region, while a fall below $311.00 may trigger further downside toward new support. The base scenario envisions continued range-bound trading as buyers and sellers reach a near-term balance.
Earlier, analysts noted that Intuit was under persistent bearish momentum despite restructuring measures and share repurchases. The latest developments, including robust quarterly results and enhanced AI-driven product offerings, suggest that while underlying structural challenges remain, improving fundamentals and innovation could increase the probability of a technical breakout should price action sustain above resistance.


-
 Afghanistan
-
 Albania
-
 Algeria
-
 Angola
-
 Argentina
-
 Armenia
-
 Australia
-
 Austria
-
 Azerbaijan
-
 Bahamas
-
 Bahrain
-
 Bangladesh
-
 Belarus
-
 Belgium
-
 Bolivia
-
 Botswana
-
 Brazil
-
 Brunei
-
 Bulgaria
-
 Cambodia
-
 Cameroon
-
 Canada
-
 Chile
Chile
-
 China
China
-
 Colombia
-
 Congo
Congo
-
 Costa Rica
-
 Cote d'Ivoire
-
 Croatia
-
 Cuba
Cuba
-
 Cyprus
-
 Czechia
-
 DR Congo
-
 Denmark
-
 Dominican Republic
-
 Ecuador
-
 Egypt
Egypt
-
 El Salvador
-
 Estonia
-
 Eswatini
-
 Ethiopia
-
 Finland
-
 France
-
 Georgia
-
 Germany
-
 Ghana
Ghana
-
 Greece
-
 Haiti
Haiti
-
 Hong Kong
-
 Hungary
-
 India
India
-
 Indonesia
-
 Iran, Islamic republic
-
 Iraq
Iraq
-
 Ireland
-
 Israel
-
 Italy
Italy
-
 Jamaica
-
 Japan
Japan
-
 Jordan
-
 Kazakhstan
-
 Kenya
Kenya
-
 Korea
Korea
-
 Kuwait
-
 Kyrgyzstan
-
 Laos
Laos
-
 Latvia
-
 Lebanon
-
 Lesotho
-
 Libya
Libya
-
 Lithuania
-
 Luxembourg
-
 Madagascar
-
 Malaysia
-
 Malta
Malta
-
 Mauritius
-
 Mexico
-
 Moldova
-
 Mongolia
-
 Montenegro
-
 Morocco
-
 Mozambique
-
 Myanmar
-
 Namibia
-
 Nepal
Nepal
-
 Netherlands
-
 New Zealand
-
 Nigeria
-
 North Macedonia
-
 Norway
-
 Oman
Oman
-
 Pakistan
-
 Palestine
-
 Panama
-
 Papua New Guinea
-
 Paraguay
-
 Peru
Peru
-
 Philippines
-
 Poland
-
 Portugal
-
 Puerto Rico
-
 Qatar
Qatar
-
 Reunion
-
 Romania
-
 Rwanda
-
 Saudi Arabia
-
 Serbia
-
 Singapore
-
 Slovakia
-
 Slovenia
-
 Somalia
-
 South Africa
-
 Spain
Spain
-
 Sri Lanka
-
 Sweden
-
 Switzerland
-
 Syria
Syria
-
 Taiwan
-
 Tajikistan
-
 Tanzania
-
 Thailand
-
 Trinidad and Tobago
-
 Tunisia
-
 Turkey
-
 UAE
UAE
-
 Uganda
-
 Ukraine
-
 United Kingdom
-
United States
-
 Uruguay
-
 Uzbekistan
-
 Venezuela
-
 Vietnam
-
 Yemen
Yemen
-
 Zambia
-
 Zimbabwe
- Forex
- Crypto
