
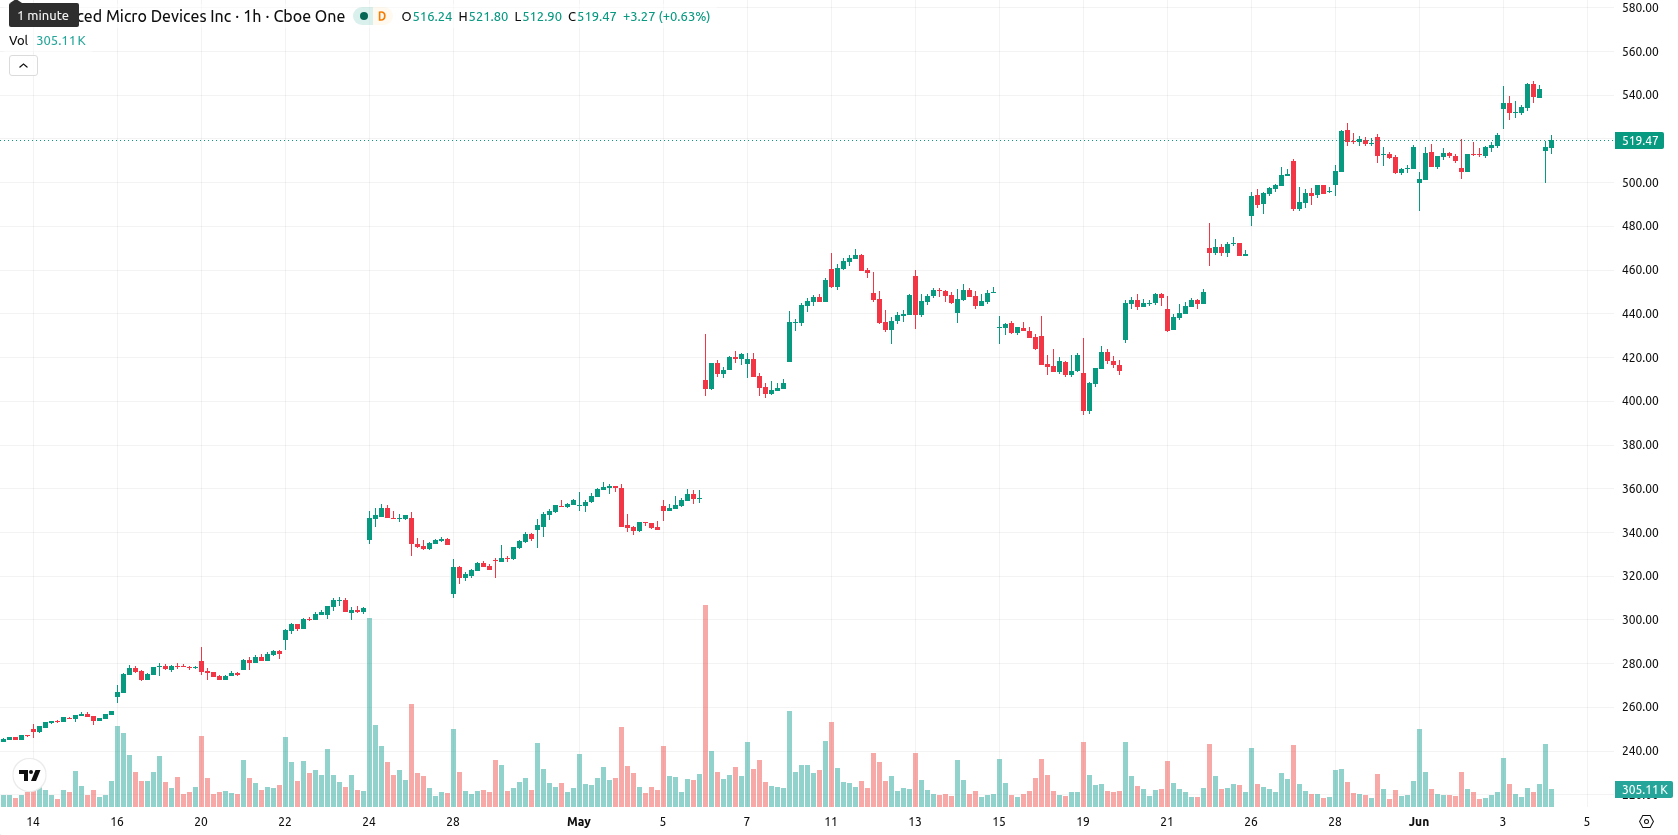
AMD stock price forecast: Key $516.62 support in focus as AMD drops 3.94%

Advanced Micro Devices, Inc. (AMD) stock is trading at $516.93, marking a decline of 3.94% for the day. The price currently sits below its short-term moving averages while maintaining a clear distance above longer-term trend levels.
Highlights
- AMD faces near-term seller pressure but maintains a structurally bullish medium- and long-term technical outlook.
- Momentum signals are mixed, with some indicators suggesting oversold conditions while others imply potential for a rebound.
- Over the next 2–3 days, AMD is likely to trade sideways between $490.39 and $548.18, with a marginally higher risk of downside.
Mixed signals emerge as technical momentum and support diverge
AMD trades below the MA-20 ($520.72), above the MA-50 ($511.52), and well above the MA-200 ($242.71) on the daily chart. The Ichimoku Kijun sits at $516.62, acting as immediate support. The MACD signals Strong Buy and the ADX remains positive, while both RSI (41.46) and CCI indicate a Sell. Meanwhile, BBP and Stoch RSI highlight oversold conditions, and the Awesome Oscillator is currently neutral. This combination signals mixed momentum and a divergence across key technical indicators.
Rangebound outlook as volatility and downside bias persist
Over the coming 2–3 trading days, AMD’s price is likely to trade within the $490.39 to $548.18 band, reflecting typical volatility relative to current levels. With probabilities tilted slightly toward further downside (down move: 54%, up move: 46%), the baseline scenario is for AMD to remain rangebound near present values. A sustained break above immediate resistance would favor upside toward the upper band, while a failure of support at the Ichimoku Kijun may expose the lower end of the range.
Earlier, analysts noted that AMD’s rally appeared increasingly fragile amid sector-wide profit-taking and concerns about valuation risks. The current mix of conflicting technical signals and heightened volatility reinforces the need for active traders to closely monitor the $490–$548 range, where any decisive move could set the tone for AMD's next direction.


Latest AMD News


-
 Afghanistan
-
 Albania
-
 Algeria
-
 Angola
-
 Argentina
-
 Armenia
-
 Australia
-
 Austria
-
 Azerbaijan
-
 Bahamas
-
 Bahrain
-
 Bangladesh
-
 Belarus
-
 Belgium
-
 Bolivia
-
 Botswana
-
 Brazil
-
 Brunei
-
 Bulgaria
-
 Cambodia
-
 Cameroon
-
 Canada
-
 Chile
Chile
-
 China
China
-
 Colombia
-
 Congo
Congo
-
 Costa Rica
-
 Cote d'Ivoire
-
 Croatia
-
 Cuba
Cuba
-
 Cyprus
-
 Czechia
-
 DR Congo
-
 Denmark
-
 Dominican Republic
-
 Ecuador
-
 Egypt
Egypt
-
 El Salvador
-
 Estonia
-
 Eswatini
-
 Ethiopia
-
 Finland
-
 France
-
 Georgia
-
 Germany
-
 Ghana
Ghana
-
 Greece
-
 Haiti
Haiti
-
 Hong Kong
-
 Hungary
-
 India
India
-
 Indonesia
-
 Iran, Islamic republic
-
 Iraq
Iraq
-
 Ireland
-
 Israel
-
 Italy
Italy
-
 Jamaica
-
 Japan
Japan
-
 Jordan
-
 Kazakhstan
-
 Kenya
Kenya
-
 Korea
Korea
-
 Kuwait
-
 Kyrgyzstan
-
 Laos
Laos
-
 Latvia
-
 Lebanon
-
 Lesotho
-
 Libya
Libya
-
 Lithuania
-
 Luxembourg
-
 Madagascar
-
 Malaysia
-
 Malta
Malta
-
 Mauritius
-
 Mexico
-
 Moldova
-
 Mongolia
-
 Montenegro
-
 Morocco
-
 Mozambique
-
 Myanmar
-
 Namibia
-
 Nepal
Nepal
-
 Netherlands
-
 New Zealand
-
 Nigeria
-
 North Macedonia
-
 Norway
-
 Oman
Oman
-
 Pakistan
-
 Palestine
-
 Panama
-
 Papua New Guinea
-
 Paraguay
-
 Peru
Peru
-
 Philippines
-
 Poland
-
 Portugal
-
 Puerto Rico
-
 Qatar
Qatar
-
 Reunion
-
 Romania
-
 Rwanda
-
 Saudi Arabia
-
 Serbia
-
 Singapore
-
 Slovakia
-
 Slovenia
-
 Somalia
-
 South Africa
-
 Spain
Spain
-
 Sri Lanka
-
 Sweden
-
 Switzerland
-
 Syria
Syria
-
 Taiwan
-
 Tajikistan
-
 Tanzania
-
 Thailand
-
 Trinidad and Tobago
-
 Tunisia
-
 Turkey
-
 UAE
UAE
-
 Uganda
-
 Ukraine
-
 United Kingdom
-
United States
-
 Uruguay
-
 Uzbekistan
-
 Venezuela
-
 Vietnam
-
 Yemen
Yemen
-
 Zambia
-
 Zimbabwe
- Forex
- Crypto
