
QUBT stock price forecast: $10.18 support as QUBT trades sideways

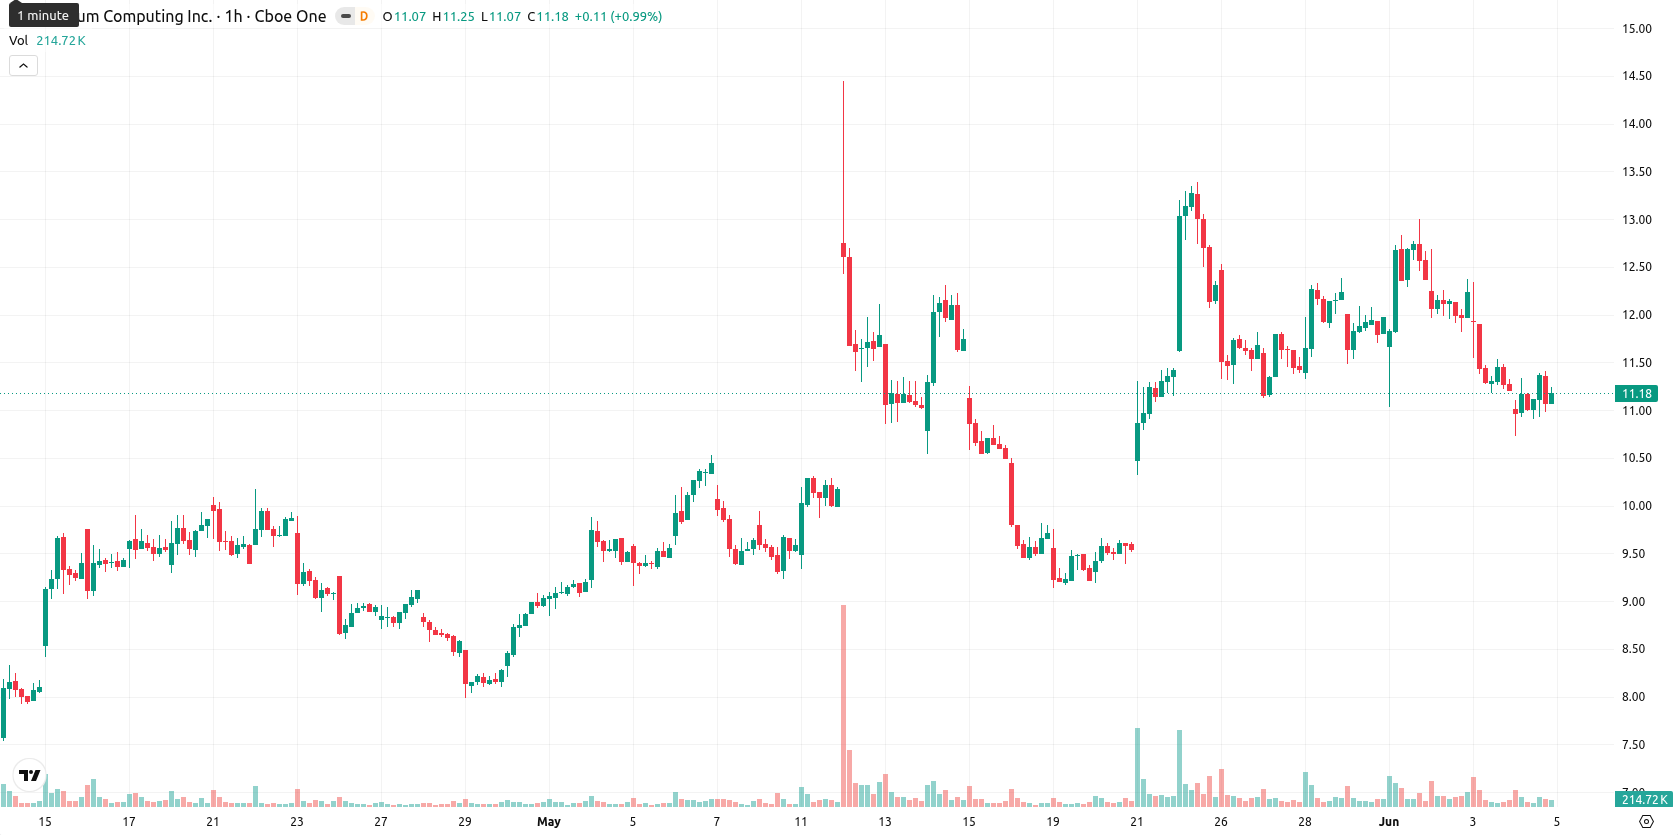
Quantum Computing Inc. (QUBT) stock is trading at $11.19 and has slid 0.09% on the day. The stock remains below its key moving averages, signaling ongoing softness compared to recent trend levels.
Highlights
- QUBT/USD remains in a bearish technical trend, trading below key moving averages across all time frames.
- Short-term momentum indicators confirm ongoing seller dominance, with only minor intraday rebounds disrupting broad downside pressure.
- Price is expected to consolidate between $10.18 and $12.20, with a break below $10.18 signaling further downside risk.
Bearish bias as technical levels and oscillators diverge
QUBT/USD is currently trading beneath the MA-20 ($11.51), MA-50 ($11.78), and MA-200 ($12.06) levels, while the Ichimoku Kijun on the daily chart stands at $11.87 as an immediate resistance reference. The expected short-term range is defined by support at $10.18 and resistance near $12.20. Technical indicators present a mostly bearish setup: MACD and RSI (42.08) are both in Sell territory, ADX remains neutral, CCI signals Sell, and BBP identifies prevailing seller dominance during intraday sessions. There is a divergence among short-term oscillators, with Stoch RSI displaying a localized Buy signal and the Awesome Oscillator reading neutral.
Downside favored as volatility confines short-term range
The most probable short-term scenario is price consolidation between $10.18 and $12.20, reflecting typical volatility for QUBT. With a 40% probability assigned to an upward move, downside remains the more likely outcome in the near term. A bullish case would require a clear break and close above resistance at $11.87, while any decisive drop below $10.18 support could accelerate fresh selling pressure and reset the acceptable range for further declines.
Earlier, analysts noted that Quantum Computing Inc. was experiencing persistent selling pressure despite mixed momentum signals, advising caution amid an uncertain outlook. The current technical landscape continues to favor the downside, with traders now watching for a break below $10.18 as a catalyst for renewed weakness.


Latest Quantum Computing News


-
 Afghanistan
-
 Albania
-
 Algeria
-
 Angola
-
 Argentina
-
 Armenia
-
 Australia
-
 Austria
-
 Azerbaijan
-
 Bahamas
-
 Bahrain
-
 Bangladesh
-
 Belarus
-
 Belgium
-
 Bolivia
-
 Botswana
-
 Brazil
-
 Brunei
-
 Bulgaria
-
 Cambodia
-
 Cameroon
-
 Canada
-
 Chile
Chile
-
 China
China
-
 Colombia
-
 Congo
Congo
-
 Costa Rica
-
 Cote d'Ivoire
-
 Croatia
-
 Cuba
Cuba
-
 Cyprus
-
 Czechia
-
 DR Congo
-
 Denmark
-
 Dominican Republic
-
 Ecuador
-
 Egypt
Egypt
-
 El Salvador
-
 Estonia
-
 Eswatini
-
 Ethiopia
-
 Finland
-
 France
-
 Georgia
-
 Germany
-
 Ghana
Ghana
-
 Greece
-
 Haiti
Haiti
-
 Hong Kong
-
 Hungary
-
 India
India
-
 Indonesia
-
 Iran, Islamic republic
-
 Iraq
Iraq
-
 Ireland
-
 Israel
-
 Italy
Italy
-
 Jamaica
-
 Japan
Japan
-
 Jordan
-
 Kazakhstan
-
 Kenya
Kenya
-
 Korea
Korea
-
 Kuwait
-
 Kyrgyzstan
-
 Laos
Laos
-
 Latvia
-
 Lebanon
-
 Lesotho
-
 Libya
Libya
-
 Lithuania
-
 Luxembourg
-
 Madagascar
-
 Malaysia
-
 Malta
Malta
-
 Mauritius
-
 Mexico
-
 Moldova
-
 Mongolia
-
 Montenegro
-
 Morocco
-
 Mozambique
-
 Myanmar
-
 Namibia
-
 Nepal
Nepal
-
 Netherlands
-
 New Zealand
-
 Nigeria
-
 North Macedonia
-
 Norway
-
 Oman
Oman
-
 Pakistan
-
 Palestine
-
 Panama
-
 Papua New Guinea
-
 Paraguay
-
 Peru
Peru
-
 Philippines
-
 Poland
-
 Portugal
-
 Puerto Rico
-
 Qatar
Qatar
-
 Reunion
-
 Romania
-
 Rwanda
-
 Saudi Arabia
-
 Serbia
-
 Singapore
-
 Slovakia
-
 Slovenia
-
 Somalia
-
 South Africa
-
 Spain
Spain
-
 Sri Lanka
-
 Sweden
-
 Switzerland
-
 Syria
Syria
-
 Taiwan
-
 Tajikistan
-
 Tanzania
-
 Thailand
-
 Trinidad and Tobago
-
 Tunisia
-
 Turkey
-
 UAE
UAE
-
 Uganda
-
 Ukraine
-
 United Kingdom
-
United States
-
 Uruguay
-
 Uzbekistan
-
 Venezuela
-
 Vietnam
-
 Yemen
Yemen
-
 Zambia
-
 Zimbabwe
- Forex
- Crypto
