
META stock holds steady amid pause in share buybacks for AI investment: weekly analysis

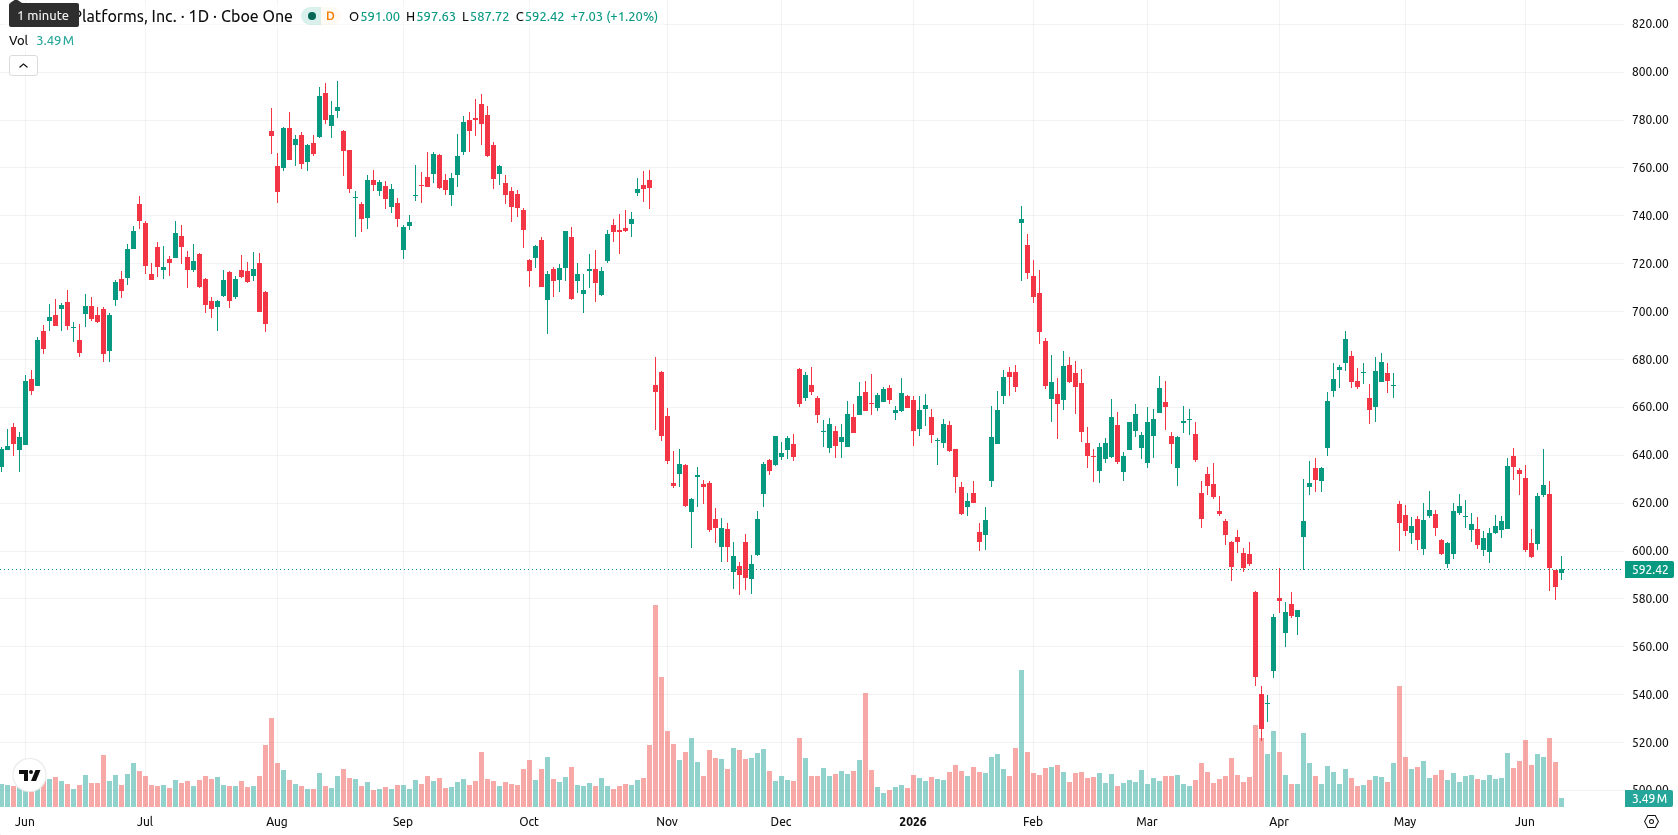
Meta Platforms, Inc. (META, formerly Facebook) closed the week at $591.77, up $1.11 or 0.47% over the past seven days. The stock continues to trade below its MA-20 ($625.73) and MA-50 ($668.26), reflecting persistent medium-term selling pressure, but remains well above the MA-200 ($462.78), indicating longer-term support.
Highlights
- Meta is consolidating near support after a recent decline, trading at $591.77 with high weekly volatility of 10.11%.
- Technical indicators show persistent bearish momentum and weak trend strength, with sellers maintaining short- and medium-term control.
- Meta is likely to trade sideways between $580 and $605; a drop below $580 could trigger renewed selling.
AI investment plans drive upbeat sentiment amid equity sale rumors
Meta reported strong Q1 2026 financial results with revenue of $56.31 billion, a 33% year-over-year increase, and earnings per share of $10.44, both well above expectations. The company raised its 2026 capital expenditure guidance to a range of $125 billion to $145 billion, prioritizing AI infrastructure and expanded data centers. News also surfaced about a potential major equity sale to fund these initiatives, though Meta called such reports speculative, while the company paused its share buyback program to allocate capital for AI investment and continued to introduce new subscription models and AI Business Agent platforms.
Sustained bearish momentum with Meta pinned near weekly lows
On the weekly chart, momentum remains weak with the MACD signaling a bearish outlook and the ADX reading at just 12.00, showing a lack of trend strength. The Relative Strength Index and Commodity Channel Index are both in bearish territory, while Stochastic RSI is neutral. Bearish sentiment is further confirmed by a negative Bull/Bear Power reading and a bearish Awesome Oscillator. Meta sits at the very bottom of its weekly range, with observed volatility at 10.11%. Key resistance lies at $605 and immediate support at $580.
Sideways trading expected as technicals cap upside next week
Over the next 5 trading days, Meta is expected to move between $580 and $605, consolidating in the lower part of its weekly range. With none of the four main W1 technical indicators signaling a buy, there is a low likelihood (less than 20%) of a sustained move higher. The baseline scenario is sideways action below resistance, while a bullish break above $605 could spur a short-term rebound. A decisive move below $580 would likely trigger renewed selling and open the way to test lower weekly supports.
Earlier, analysts noted that Meta’s intensified investment in AI infrastructure and a pause in share buybacks were driving persistent pressure on the stock amid heightened volatility. The current technical picture reinforces expectations of subdued upward momentum, with traders advised to monitor the $605 resistance and $580 support as pivots for potential breakouts or downside risk in the week ahead.


-
 Afghanistan
-
 Albania
-
 Algeria
-
 Angola
-
 Argentina
-
 Armenia
-
 Australia
-
 Austria
-
 Azerbaijan
-
 Bahamas
-
 Bahrain
-
 Bangladesh
-
 Belarus
-
 Belgium
-
 Bolivia
-
 Botswana
-
 Brazil
-
 Brunei
-
 Bulgaria
-
 Cambodia
-
 Cameroon
-
 Canada
-
 Chile
Chile
-
 China
China
-
 Colombia
-
 Congo
Congo
-
 Costa Rica
-
 Cote d'Ivoire
-
 Croatia
-
 Cuba
Cuba
-
 Cyprus
-
 Czechia
-
 DR Congo
-
 Denmark
-
 Dominican Republic
-
 Ecuador
-
 Egypt
Egypt
-
 El Salvador
-
 Estonia
-
 Eswatini
-
 Ethiopia
-
 Finland
-
 France
-
 Georgia
-
 Germany
-
 Ghana
Ghana
-
 Greece
-
 Haiti
Haiti
-
 Hong Kong
-
 Hungary
-
 India
India
-
 Indonesia
-
 Iran, Islamic republic
-
 Iraq
Iraq
-
 Ireland
-
 Israel
-
 Italy
Italy
-
 Jamaica
-
 Japan
Japan
-
 Jordan
-
 Kazakhstan
-
 Kenya
Kenya
-
 Korea
Korea
-
 Kuwait
-
 Kyrgyzstan
-
 Laos
Laos
-
 Latvia
-
 Lebanon
-
 Lesotho
-
 Libya
Libya
-
 Lithuania
-
 Luxembourg
-
 Madagascar
-
 Malaysia
-
 Malta
Malta
-
 Mauritius
-
 Mexico
-
 Moldova
-
 Mongolia
-
 Montenegro
-
 Morocco
-
 Mozambique
-
 Myanmar
-
 Namibia
-
 Nepal
Nepal
-
 Netherlands
-
 New Zealand
-
 Nigeria
-
 North Macedonia
-
 Norway
-
 Oman
Oman
-
 Pakistan
-
 Palestine
-
 Panama
-
 Papua New Guinea
-
 Paraguay
-
 Peru
Peru
-
 Philippines
-
 Poland
-
 Portugal
-
 Puerto Rico
-
 Qatar
Qatar
-
 Reunion
-
 Romania
-
 Rwanda
-
 Saudi Arabia
-
 Serbia
-
 Singapore
-
 Slovakia
-
 Slovenia
-
 Somalia
-
 South Africa
-
 Spain
Spain
-
 Sri Lanka
-
 Sweden
-
 Switzerland
-
 Syria
Syria
-
 Taiwan
-
 Tajikistan
-
 Tanzania
-
 Thailand
-
 Trinidad and Tobago
-
 Tunisia
-
 Turkey
-
 UAE
UAE
-
 Uganda
-
 Ukraine
-
 United Kingdom
-
United States
-
 Uruguay
-
 Uzbekistan
-
 Venezuela
-
 Vietnam
-
 Yemen
Yemen
-
 Zambia
-
 Zimbabwe
- Forex
- Crypto
