
The Trade Desk stock price forecast: $20.49 resistance as TTD advances 3.22%

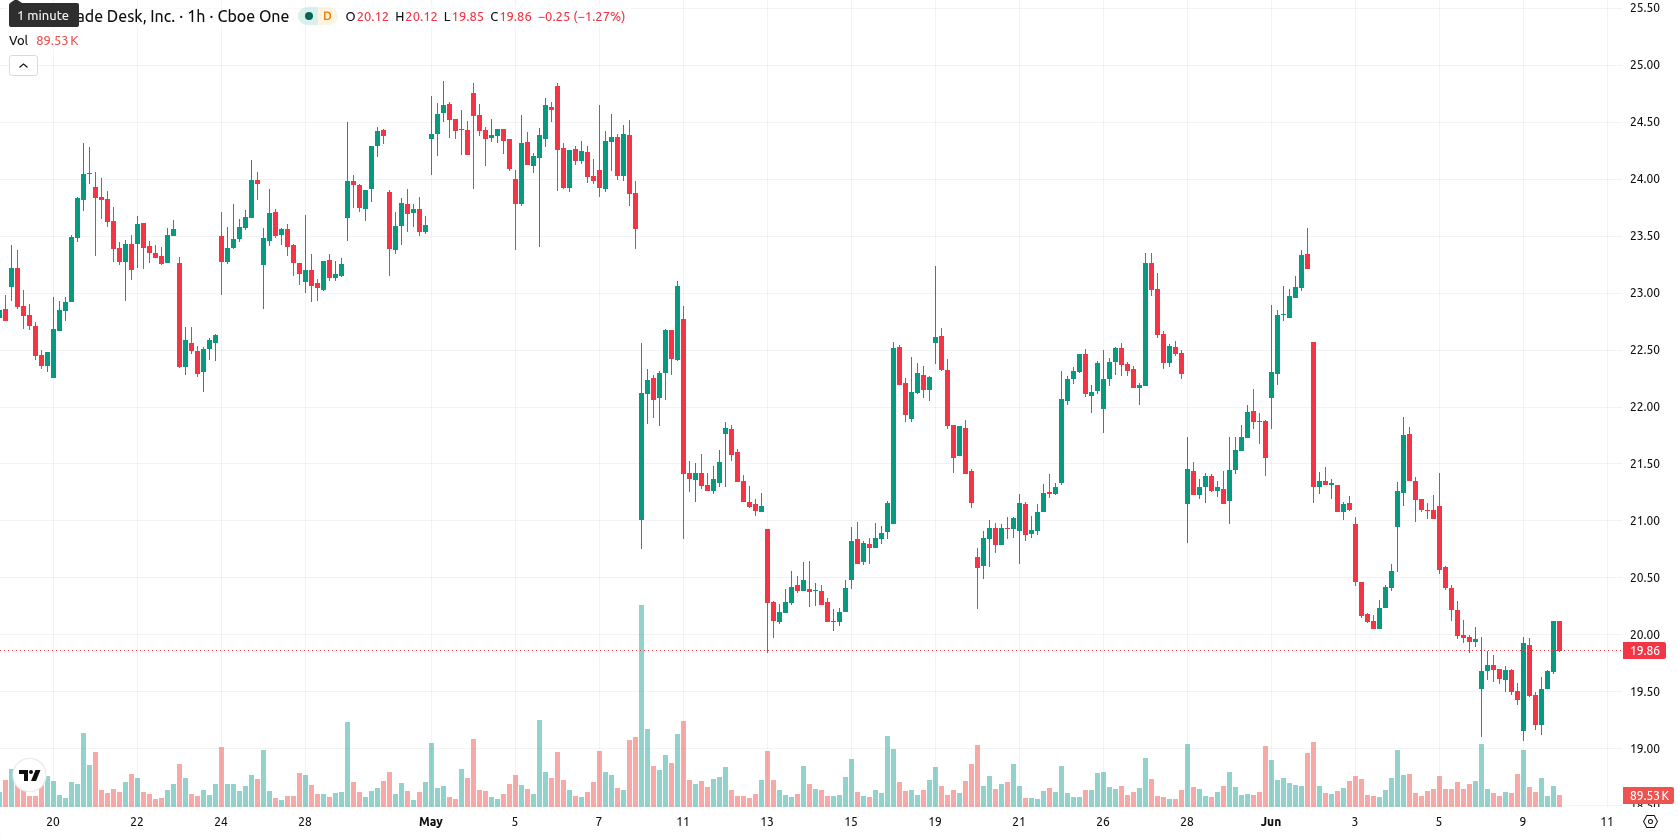
The Trade Desk (TTD) stock is trading at $20.06, up 3.22% for the day and near its session high. The price sits above its short-term averages but remains capped by key medium- and longer-term moving averages, reflecting mixed momentum.
Highlights
- The Trade Desk has intensified capital returns, repurchasing $2.26 billion in shares and expanding buybacks to $2.76 billion despite softening fundamentals.
- Management is prioritizing shareholder value amid margin pressure and slowing revenue, while ongoing executive turnover signals continued leadership transition.
- Technically, TTD stock faces dominant bearish momentum with a projected price range of $18.80 to $21.32 and limited probability of near-term upside.
Buybacks and management changes drive value amid margin compression
The Trade Desk has repurchased approximately $2.26 billion of its stock since 2023 and expanded its buyback authorization to $2.76 billion, providing direct mechanical support to per-share value and offsetting perceived pressure from softer fundamentals. This capital return comes as the company faces compressed EBITDA margins and decelerating revenue, signaling management's focus on shareholder returns. Meanwhile, executive changes continue with the departure of Chief Revenue Officer Anders Mortensen after just seven months, and with Nate Olmstead set to become CFO as of July 9, 2026, marking an ongoing transition in the leadership team.
Bearish momentum dominates below key averages as signals diverge
On the technical front, TTD is now trading above its MA-20, while remaining below both the MA-50 (hourly) and MA-200 (daily) levels. The Ichimoku Kijun sits at $20.49 and marks immediate resistance. Momentum indicators show strong bearish bias: the MACD presents a firm sell signal and the ADX confirms a selling trend. The RSI stands at 42.45 in the sell zone, with Stoch RSI indicating overbought conditions and CCI reading as neutral. Bull/Bear Power (BBP) also signals ongoing selling pressure, suggesting sellers are dominating intraday price action. The Awesome Oscillator (AO) remains neutral, failing to reinforce either side, while oscillators and trend signals diverge, creating a conflicting technical landscape.
Downside risk favored as consolidation range defines outlook
In the short term, TTD's price is expected to consolidate within a projected range of $18.80 to $21.32, reflecting a volatility band relative to current levels. With an up probability of just 22% and a 78% likelihood of a move lower, downside risk is favored in the immediate sessions. The baseline scenario anticipates stabilization within this corridor. A break above the $20.49 resistance could prompt renewed buying interest, while a fall below $18.80 would likely trigger further selling pressure.
Previously it was reported that The Trade Desk was experiencing persistent downside momentum, with technical signals indicating continued bearish pressure. Despite recent price strength and expanded share repurchases, traders should continue to monitor for a sustained break above the $20.49 resistance as confirmation of any meaningful shift in direction.


Latest The Trade Desk News


-
 Afghanistan
-
 Albania
-
 Algeria
-
 Angola
-
 Argentina
-
 Armenia
-
 Australia
-
 Austria
-
 Azerbaijan
-
 Bahamas
-
 Bahrain
-
 Bangladesh
-
 Belarus
-
 Belgium
-
 Bolivia
-
 Botswana
-
 Brazil
-
 Brunei
-
 Bulgaria
-
 Cambodia
-
 Cameroon
-
 Canada
-
 Chile
Chile
-
 China
China
-
 Colombia
-
 Congo
Congo
-
 Costa Rica
-
 Cote d'Ivoire
-
 Croatia
-
 Cuba
Cuba
-
 Cyprus
-
 Czechia
-
 DR Congo
-
 Denmark
-
 Dominican Republic
-
 Ecuador
-
 Egypt
Egypt
-
 El Salvador
-
 Estonia
-
 Eswatini
-
 Ethiopia
-
 Finland
-
 France
-
 Georgia
-
 Germany
-
 Ghana
Ghana
-
 Greece
-
 Haiti
Haiti
-
 Hong Kong
-
 Hungary
-
 India
India
-
 Indonesia
-
 Iran, Islamic republic
-
 Iraq
Iraq
-
 Ireland
-
 Israel
-
 Italy
Italy
-
 Jamaica
-
 Japan
Japan
-
 Jordan
-
 Kazakhstan
-
 Kenya
Kenya
-
 Korea
Korea
-
 Kuwait
-
 Kyrgyzstan
-
 Laos
Laos
-
 Latvia
-
 Lebanon
-
 Lesotho
-
 Libya
Libya
-
 Lithuania
-
 Luxembourg
-
 Madagascar
-
 Malaysia
-
 Malta
Malta
-
 Mauritius
-
 Mexico
-
 Moldova
-
 Mongolia
-
 Montenegro
-
 Morocco
-
 Mozambique
-
 Myanmar
-
 Namibia
-
 Nepal
Nepal
-
 Netherlands
-
 New Zealand
-
 Nigeria
-
 North Macedonia
-
 Norway
-
 Oman
Oman
-
 Pakistan
-
 Palestine
-
 Panama
-
 Papua New Guinea
-
 Paraguay
-
 Peru
Peru
-
 Philippines
-
 Poland
-
 Portugal
-
 Puerto Rico
-
 Qatar
Qatar
-
 Reunion
-
 Romania
-
 Rwanda
-
 Saudi Arabia
-
 Serbia
-
 Singapore
-
 Slovakia
-
 Slovenia
-
 Somalia
-
 South Africa
-
 Spain
Spain
-
 Sri Lanka
-
 Sweden
-
 Switzerland
-
 Syria
Syria
-
 Taiwan
-
 Tajikistan
-
 Tanzania
-
 Thailand
-
 Trinidad and Tobago
-
 Tunisia
-
 Turkey
-
 UAE
UAE
-
 Uganda
-
 Ukraine
-
 United Kingdom
-
United States
-
 Uruguay
-
 Uzbekistan
-
 Venezuela
-
 Vietnam
-
 Yemen
Yemen
-
 Zambia
-
 Zimbabwe
- Forex
- Crypto
