
Zoom stock price forecast: $86.68 support key as ZM slides 3.02%

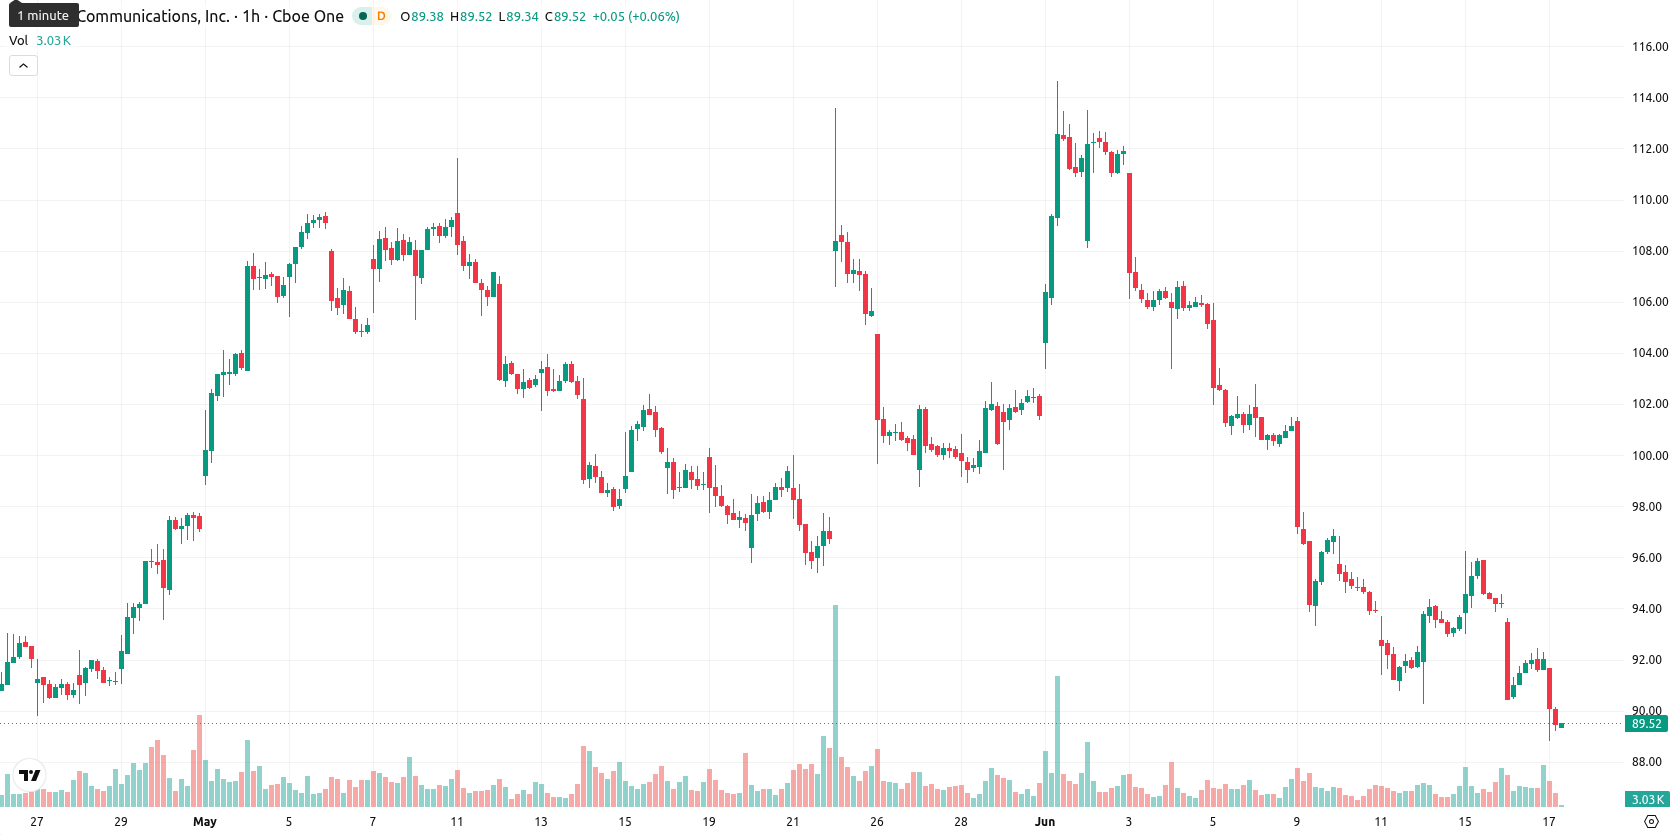
Zoom Video Communications, Inc. (ZM) stock is trading at $89.32, marking a decline of 3.02% on the day. Shares are positioned below their main short- and medium-term moving averages, highlighting near-term selling pressure relative to these technical levels.
Highlights
- Zoom introduced its ZoomMate AI platform, targeting enterprise customers with enhanced conversational and task automation capabilities.
- CFO Michelle Chang sold 327 company shares amid ongoing share price weakness, potentially influencing investor sentiment toward management's outlook.
- Technical momentum remains strongly bearish, with seller dominance and ZM expected to trade between $86.68 and $93.48 in the near term.
AI platform launch and insider sale impact sentiment amid price drop
Zoom Communications Inc. launched the ZoomMate agentic AI platform on June 1, 2026, introducing advanced tools intended to streamline workplace conversations and integrate task execution. This product initiative places a strategic emphasis on harnessing AI to broaden functionality for enterprise clients, which may shift customer adoption trends going forward. Separately, Michelle Chang, the company's Chief Financial Officer, executed a sale of 327 Zoom shares on June 15, 2026, as disclosed in an SEC filing, an action that can occasionally influence observations of leadership's internal outlook. Both developments come amid a backdrop of notable downside pressure in the share price.
Bearish signals increase as ZM tests technical boundaries and momentum weakens
On the hourly timeframe, ZM trades below both its MA-20 at $92.87 and MA-50 at $94.30, while still holding above the daily MA-200 of $87.16. The Ichimoku Kijun sits at $92.85 and serves as an immediate resistance level. Key momentum indicators reflect strong seller dominance: MACD and ADX show a sell bias, RSI is at 31.92 (oversold), and Stoch RSI, CCI, and BBP are all confirming persistent bearish momentum. The Awesome Oscillator further reinforces this downside trend, and no significant divergence is observed between oscillators and intraday momentum signals.
Downside extension favored as breakout probabilities remain low
In the near term, ZM is expected to trade within a volatility band defined by $86.68 as support and $93.48 as resistance. The probability of an upward breakout remains very low, while a downside extension is considerably more likely under current market conditions. The baseline scenario is for price to consolidate within this corridor; a bullish move would require a breakthrough above $92.85 resistance, while further weakness would be confirmed if support at $86.68 is breached.
Earlier, analysts noted that Zoom faced sustained short- and medium-term selling pressure, with technical indicators signaling persistent resistance and a cautious outlook. With downside momentum intensifying and AI-driven product developments yet to improve sentiment, the prevailing risk is a test of the $86.68 support, which could trigger further volatility if breached.


Latest Zoom News


-
 Afghanistan
-
 Albania
-
 Algeria
-
 Angola
-
 Argentina
-
 Armenia
-
 Australia
-
 Austria
-
 Azerbaijan
-
 Bahamas
-
 Bahrain
-
 Bangladesh
-
 Belarus
-
 Belgium
-
 Bolivia
-
 Botswana
-
 Brazil
-
 Brunei
-
 Bulgaria
-
 Cambodia
-
 Cameroon
-
 Canada
-
 Chile
Chile
-
 China
China
-
 Colombia
-
 Congo
Congo
-
 Costa Rica
-
 Cote d'Ivoire
-
 Croatia
-
 Cuba
Cuba
-
 Cyprus
-
 Czechia
-
 DR Congo
-
 Denmark
-
 Dominican Republic
-
 Ecuador
-
 Egypt
Egypt
-
 El Salvador
-
 Estonia
-
 Eswatini
-
 Ethiopia
-
 Finland
-
 France
-
 Georgia
-
 Germany
-
 Ghana
Ghana
-
 Greece
-
 Haiti
Haiti
-
 Hong Kong
-
 Hungary
-
 India
India
-
 Indonesia
-
 Iran, Islamic republic
-
 Iraq
Iraq
-
 Ireland
-
 Israel
-
 Italy
Italy
-
 Jamaica
-
 Japan
Japan
-
 Jordan
-
 Kazakhstan
-
 Kenya
Kenya
-
 Korea
Korea
-
 Kuwait
-
 Kyrgyzstan
-
 Laos
Laos
-
 Latvia
-
 Lebanon
-
 Lesotho
-
 Libya
Libya
-
 Lithuania
-
 Luxembourg
-
 Madagascar
-
 Malaysia
-
 Malta
Malta
-
 Mauritius
-
 Mexico
-
 Moldova
-
 Mongolia
-
 Montenegro
-
 Morocco
-
 Mozambique
-
 Myanmar
-
 Namibia
-
 Nepal
Nepal
-
 Netherlands
-
 New Zealand
-
 Nigeria
-
 North Macedonia
-
 Norway
-
 Oman
Oman
-
 Pakistan
-
 Palestine
-
 Panama
-
 Papua New Guinea
-
 Paraguay
-
 Peru
Peru
-
 Philippines
-
 Poland
-
 Portugal
-
 Puerto Rico
-
 Qatar
Qatar
-
 Reunion
-
 Romania
-
 Rwanda
-
 Saudi Arabia
-
 Serbia
-
 Singapore
-
 Slovakia
-
 Slovenia
-
 Somalia
-
 South Africa
-
 Spain
Spain
-
 Sri Lanka
-
 Sweden
-
 Switzerland
-
 Syria
Syria
-
 Taiwan
-
 Tajikistan
-
 Tanzania
-
 Thailand
-
 Trinidad and Tobago
-
 Tunisia
-
 Turkey
-
 UAE
UAE
-
 Uganda
-
 Ukraine
-
 United Kingdom
-
United States
-
 Uruguay
-
 Uzbekistan
-
 Venezuela
-
 Vietnam
-
 Yemen
Yemen
-
 Zambia
-
 Zimbabwe
- Forex
- Crypto
