
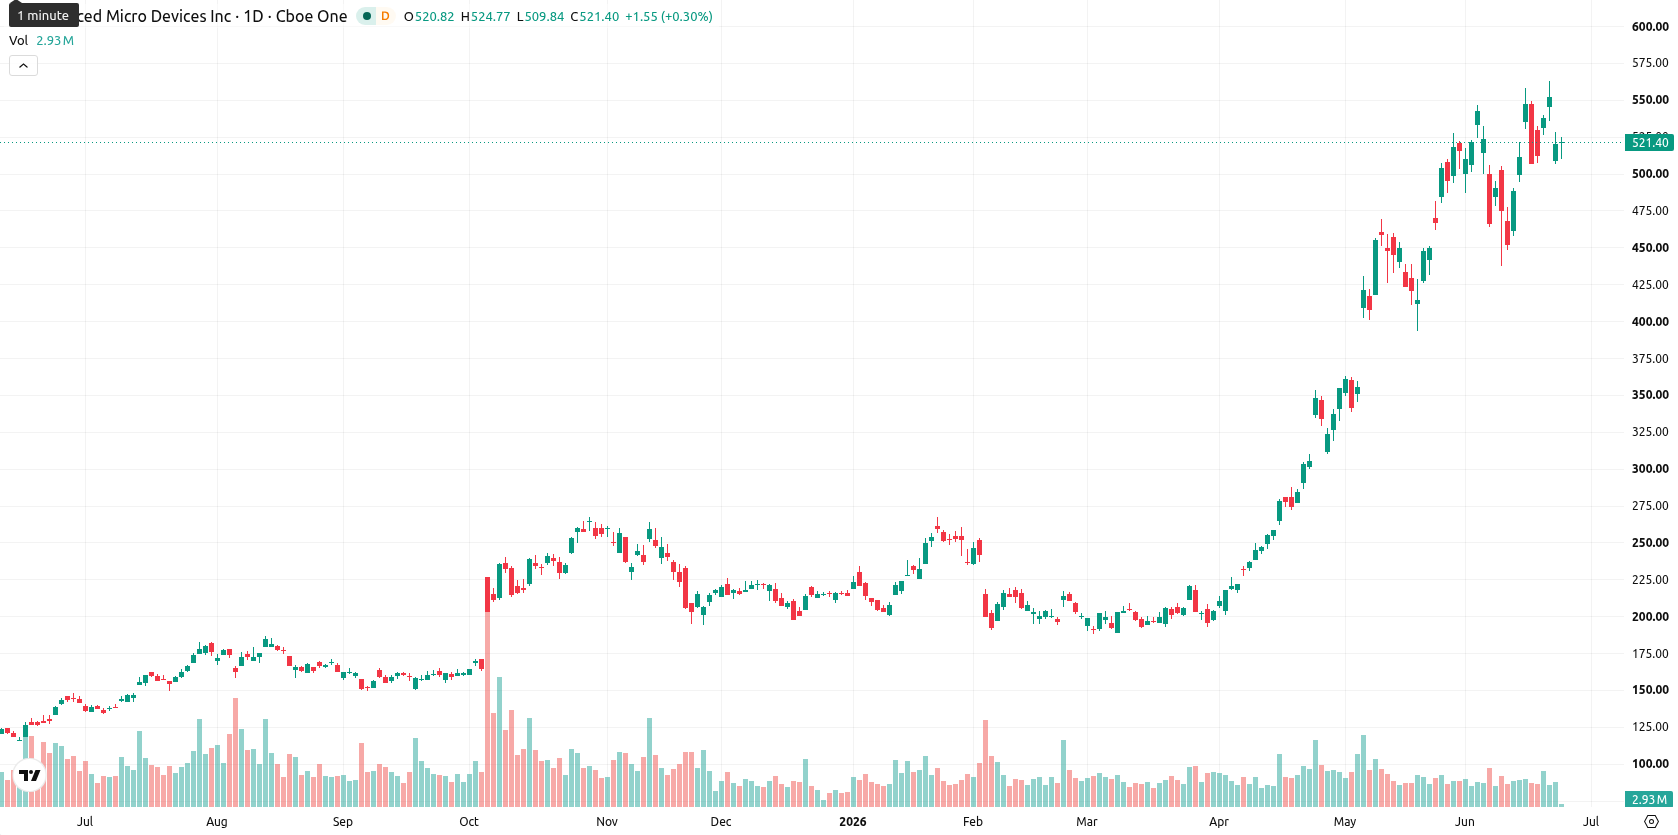
AMD shares retreat, holding firm above MA-50 support at $255.73: weekly forecast

Advanced Micro Devices, Inc. (AMD) is trading at $522.30, significantly above the weekly MA-20 at $337.07, MA-50 at $255.73, and MA-200 at $153.81. Over the past week, AMD fell $14.75 (2.97%), closing at the bottom of the weekly range, and retaining a strong bullish structure as it stays well above key moving averages.
Highlights
- AMD maintains a strong bullish structure, trading significantly above major moving averages, with buyers firmly in control.
- Despite persistent upside momentum, multiple overbought signals and a sharp weekly retracement indicate risk of a short-term pullback.
- AMD is expected to trade in a $473–$572 range this week, with a 75% probability bias toward consolidation or further upside.
Earnings beat and data centre growth lift sentiment this week
AMD posted its Q1 2026 financial results on May 5, 2026, with adjusted earnings per share of $1.37, beating expectations. Quarterly revenue rose 37.8% year-over-year to $10.25 billion, led by a 57% increase in data centre revenue to $5.80 billion. Management highlighted increased visibility into growth thanks to strong customer commitments for the MI450 series.
Bullish momentum persists as overbought risks emerge this week
Weekly technical indicators remain positive, with MACD and ADX confirming the ongoing bullish trend, although several overbought signals are present as shown by elevated RSI, CCI, and Bull/Bear Power values; the Stochastic RSI points to the possibility of a short-lived pullback. AMD holds firm support at the MA-50 level. Key weekly support lies at $473, while resistance is seen near $572.
Consolidation favored as breakout risk builds for the coming week
Over the next five trading days, AMD is likely to consolidate between $473 and $572, reflecting its recent volatility and strong technical position above long-term moving averages. There is a 75% probability of a higher move and a 25% risk of further decline based on weekly indicators. A clear break above $572 would signal renewed bullish momentum, while a move below $473 could trigger a more significant correction.
Earlier, analysts noted that AMD and other AI-linked semiconductor stocks were benefiting from accelerating demand and positive investor sentiment. The latest earnings and ongoing technical strength now reinforce AMD's leadership within the sector, with traders advised to monitor the $572 resistance for signs of breakout-driven momentum.


Latest AMD News


-
 Afghanistan
-
 Albania
-
 Algeria
-
 Angola
-
 Argentina
-
 Armenia
-
 Australia
-
 Austria
-
 Azerbaijan
-
 Bahamas
-
 Bahrain
-
 Bangladesh
-
 Belarus
-
 Belgium
-
 Bolivia
-
 Botswana
-
 Brazil
-
 Brunei
-
 Bulgaria
-
 Cambodia
-
 Cameroon
-
 Canada
-
 Chile
Chile
-
 China
China
-
 Colombia
-
 Congo
Congo
-
 Costa Rica
-
 Cote d'Ivoire
-
 Croatia
-
 Cuba
Cuba
-
 Cyprus
-
 Czechia
-
 DR Congo
-
 Denmark
-
 Dominican Republic
-
 Ecuador
-
 Egypt
Egypt
-
 El Salvador
-
 Estonia
-
 Eswatini
-
 Ethiopia
-
 Finland
-
 France
-
 Georgia
-
 Germany
-
 Ghana
Ghana
-
 Greece
-
 Haiti
Haiti
-
 Hong Kong
-
 Hungary
-
 India
India
-
 Indonesia
-
 Iran, Islamic republic
-
 Iraq
Iraq
-
 Ireland
-
 Israel
-
 Italy
Italy
-
 Jamaica
-
 Japan
Japan
-
 Jordan
-
 Kazakhstan
-
 Kenya
Kenya
-
 Korea
Korea
-
 Kuwait
-
 Kyrgyzstan
-
 Laos
Laos
-
 Latvia
-
 Lebanon
-
 Lesotho
-
 Libya
Libya
-
 Lithuania
-
 Luxembourg
-
 Madagascar
-
 Malaysia
-
 Malta
Malta
-
 Mauritius
-
 Mexico
-
 Moldova
-
 Mongolia
-
 Montenegro
-
 Morocco
-
 Mozambique
-
 Myanmar
-
 Namibia
-
 Nepal
Nepal
-
 Netherlands
-
 New Zealand
-
 Nigeria
-
 North Macedonia
-
 Norway
-
 Oman
Oman
-
 Pakistan
-
 Palestine
-
 Panama
-
 Papua New Guinea
-
 Paraguay
-
 Peru
Peru
-
 Philippines
-
 Poland
-
 Portugal
-
 Puerto Rico
-
 Qatar
Qatar
-
 Reunion
-
 Romania
-
 Rwanda
-
 Saudi Arabia
-
 Serbia
-
 Singapore
-
 Slovakia
-
 Slovenia
-
 Somalia
-
 South Africa
-
 Spain
Spain
-
 Sri Lanka
-
 Sweden
-
 Switzerland
-
 Syria
Syria
-
 Taiwan
-
 Tajikistan
-
 Tanzania
-
 Thailand
-
 Trinidad and Tobago
-
 Tunisia
-
 Turkey
-
 UAE
UAE
-
 Uganda
-
 Ukraine
-
 United Kingdom
-
United States
-
 Uruguay
-
 Uzbekistan
-
 Venezuela
-
 Vietnam
-
 Yemen
Yemen
-
 Zambia
-
 Zimbabwe
- Forex
- Crypto
