
Riot Platforms stock drops as price stays under major moving averages

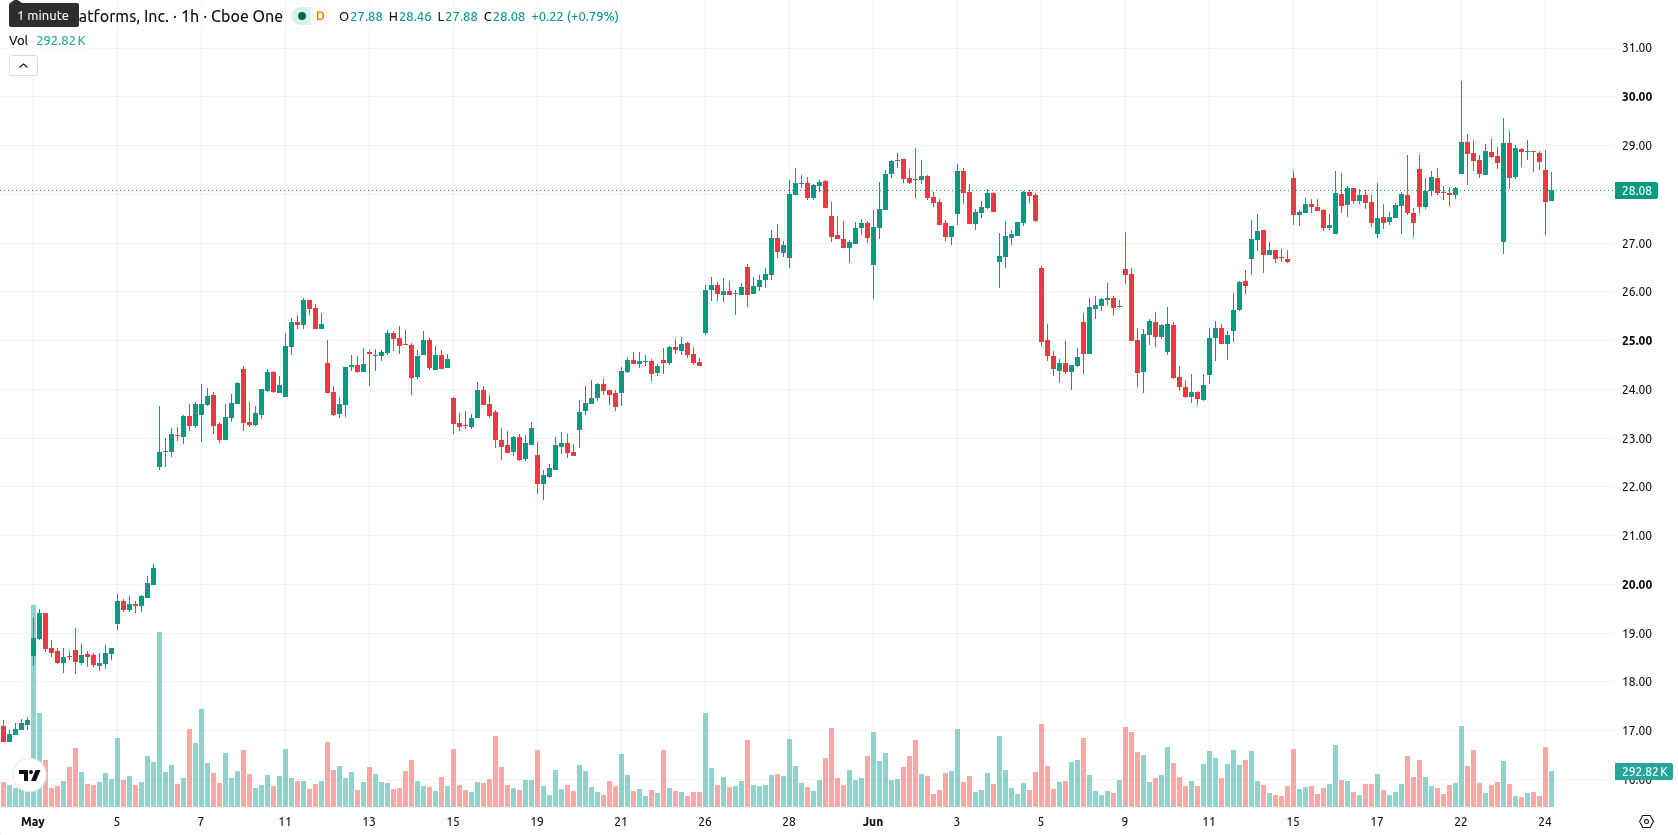
Riot Platforms (RIOT) stock is trading at $27.28 after a daily decline of 4.93%. The price finished the session below its key moving averages, highlighting pronounced downward momentum over the short term.
 19.05
21.57
19.05
21.57
Highlights
- RIOT/USD faces short- and medium-term selling pressure, trading below key moving averages amid high volatility.
- Technical momentum is mixed, with some indicators signaling bullish potential while others point to oversold conditions and persistent selling.
- Expected trading range is $25.71 to $29.01, with a 53% chance of downward movement and $28.54 as immediate resistance.
Bullish divergence contrasts with short-term selling below resistance
RIOT/USD is trading below the MA-20 ($28.61) and MA-50 ($27.95) on the H1 chart, with key resistance at the Ichimoku Kijun ($28.54). The long-term MA-200 remains far below at $17.96, while immediate support is near $25.71 and resistance at $29.01. Momentum signals present divergence: MACD (Strong Buy) and ADX (Buy) suggest bullish attempts, while BBP signals a Sell, RSI at 54.3 gives a mild positive bias, Stoch RSI shows oversold levels, and CCI along with AO are neutral—reflecting overall indecision but persistent short-term selling pressure.
Range-bound oscillation expected amid persistent volatility
In the short term, RIOT is likely to oscillate between $25.71 and $29.01, reflecting typical volatility observed in recent sessions. Forecast models assign a slight probability edge to further downside (53%), though bullish momentum could take hold if price breaks above immediate resistance at $28.54. A move above this threshold could attract momentum buyers, while a slip below $25.71 may trigger further short-term selling and reinforce downside risk.
Earlier, analysts noted that Riot Platforms was sustaining bullish momentum with strong technical support, though overbought signals suggested caution. The current shift to pronounced short-term selling pressure adds a new dimension to the outlook, making the $28.54 resistance level critical for any potential recovery in the coming sessions.







-
 Afghanistan
-
 Albania
-
 Algeria
-
 Angola
-
 Argentina
-
 Armenia
-
 Australia
-
 Austria
-
 Azerbaijan
-
 Bahamas
-
 Bahrain
-
 Bangladesh
-
 Belarus
-
 Belgium
-
 Bolivia
-
 Botswana
-
 Brazil
-
 Brunei
-
 Bulgaria
-
 Cambodia
-
 Cameroon
-
 Canada
-
 Chile
Chile
-
 China
China
-
 Colombia
-
 Congo
Congo
-
 Costa Rica
-
 Cote d'Ivoire
-
 Croatia
-
 Cuba
Cuba
-
 Cyprus
-
 Czechia
-
 DR Congo
-
 Denmark
-
 Dominican Republic
-
 Ecuador
-
 Egypt
Egypt
-
 El Salvador
-
 Estonia
-
 Eswatini
-
 Ethiopia
-
 Finland
-
 France
-
 Georgia
-
 Germany
-
 Ghana
Ghana
-
 Greece
-
 Haiti
Haiti
-
 Hong Kong
-
 Hungary
-
 India
India
-
 Indonesia
-
 Iran, Islamic republic
-
 Iraq
Iraq
-
 Ireland
-
 Israel
-
 Italy
Italy
-
 Jamaica
-
 Japan
Japan
-
 Jordan
-
 Kazakhstan
-
 Kenya
Kenya
-
 Korea
Korea
-
 Kuwait
-
 Kyrgyzstan
-
 Laos
Laos
-
 Latvia
-
 Lebanon
-
 Lesotho
-
 Libya
Libya
-
 Lithuania
-
 Luxembourg
-
 Madagascar
-
 Malaysia
-
 Malta
Malta
-
 Mauritius
-
 Mexico
-
 Moldova
-
 Mongolia
-
 Montenegro
-
 Morocco
-
 Mozambique
-
 Myanmar
-
 Namibia
-
 Nepal
Nepal
-
 Netherlands
-
 New Zealand
-
 Nigeria
-
 North Macedonia
-
 Norway
-
 Oman
Oman
-
 Pakistan
-
 Palestine
-
 Panama
-
 Papua New Guinea
-
 Paraguay
-
 Peru
Peru
-
 Philippines
-
 Poland
-
 Portugal
-
 Puerto Rico
-
 Qatar
Qatar
-
 Reunion
-
 Romania
-
 Rwanda
-
 Saudi Arabia
-
 Serbia
-
 Singapore
-
 Slovakia
-
 Slovenia
-
 Somalia
-
 South Africa
-
 Spain
Spain
-
 Sri Lanka
-
 Sweden
-
 Switzerland
-
 Syria
Syria
-
 Taiwan
-
 Tajikistan
-
 Tanzania
-
 Thailand
-
 Trinidad and Tobago
-
 Tunisia
-
 Turkey
-
 UAE
UAE
-
 Uganda
-
 Ukraine
-
 United Kingdom
-
United States
-
 Uruguay
-
 Uzbekistan
-
 Venezuela
-
 Vietnam
-
 Yemen
Yemen
-
 Zambia
-
 Zimbabwe
- Forex
- Crypto











