
+10.74% for Affirm stock as overbought signals hint at possible short-term pullback

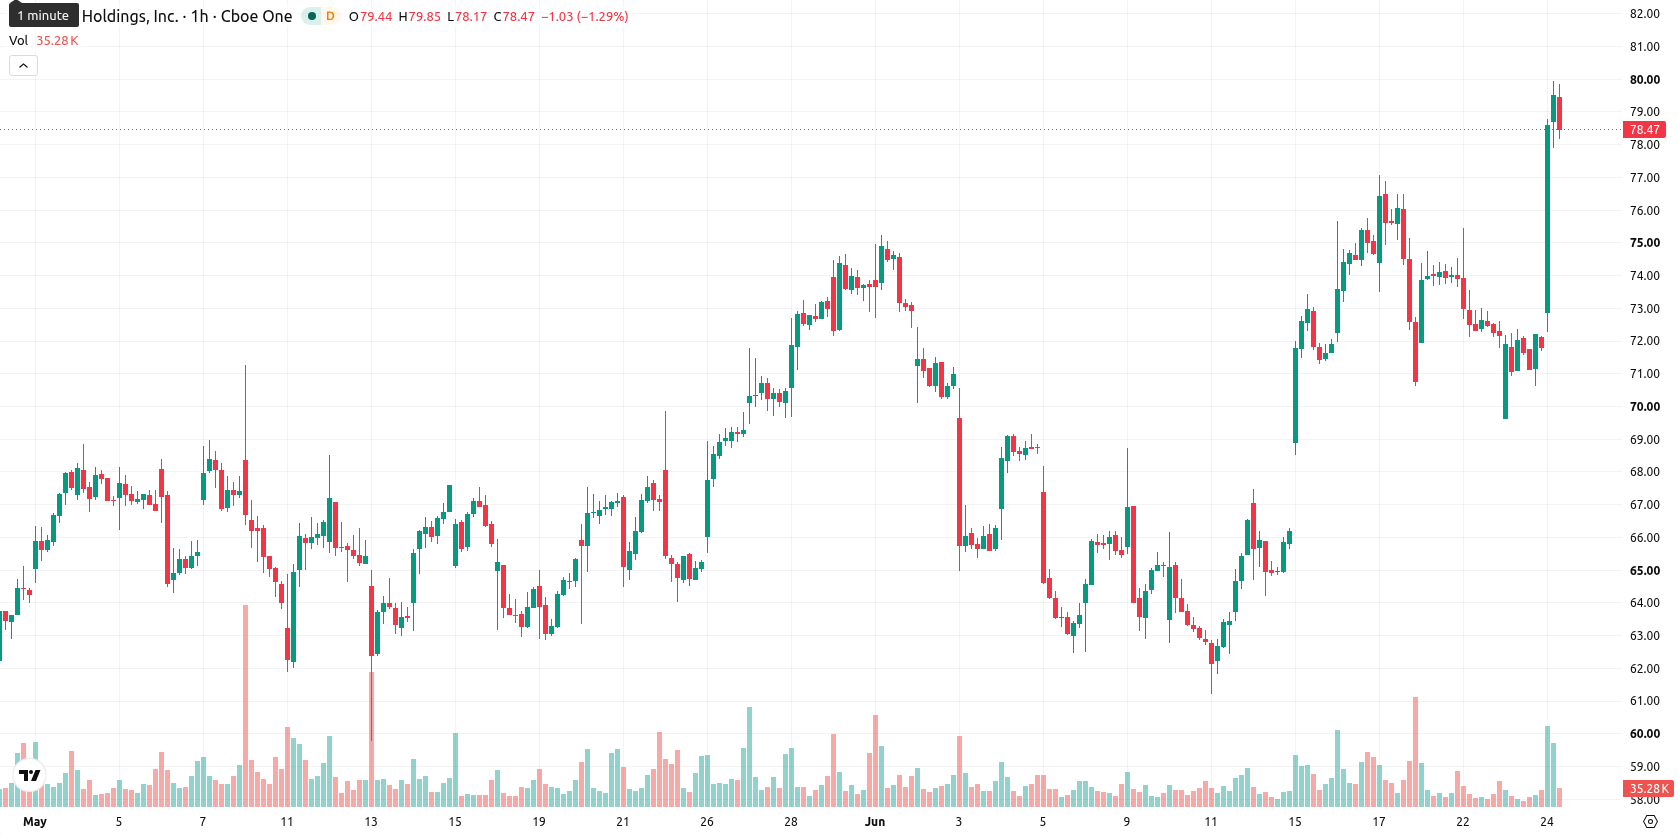
Affirm Holdings, Inc. (AFRM) stock is trading at $79.54, marking a daily gain of 10.74%. The price is firmly positioned above its key moving averages, reflecting strong near-term momentum.
Highlights
- Affirm maintains a strong bullish trend, trading decisively above key short- and long-term moving averages.
- Momentum indicators signal aggressive buying pressure, but the asset is currently exhibiting overbought conditions demanding caution.
- Price is projected to consolidate between $76.39 and $82.11 in the next 2–3 days, with a 78% probability of an upside move.
Overbought risk emerges as indicators flag momentum, support holds
On the technical front, AFRM trades above the $73.11 level of the 20-period moving average and the $72.49 level of the 50-period moving average on the hourly chart, with long-term support from the 200-period moving average at $66.53. The Ichimoku Kijun line at $74.19 forms a clear immediate support. Technical indicators show robust momentum: the Moving Average Convergence Divergence (MACD) and Average Directional Index (ADX) are in buy mode, while the Relative Strength Index (RSI) is elevated at 72.28, alongside overbought readings in the Stochastic RSI, Commodity Channel Index (CCI), and Bull/Bear Power. The Awesome Oscillator also endorses the positive bias. However, these overbought readings highlight the risk of a near-term reversal or at least a pause as momentum and oscillator signals diverge.
Bullish bias prevails while volatility bands define outlook
Over the next two to three sessions, AFRM is likely to consolidate within a volatility band of $76.39 to $82.11. The current probability structure skews bullish, with a 78% chance of a continued upward move and a 22% likelihood of near-term downside. If price decisively clears the range top, further gains above $82.11 may follow. A break below support at $76.39 would increase the risk of a sharper short-term pullback.
Earlier, analysts noted that Affirm was exhibiting strong bullish momentum supported by favorable technical indicators and resilient investor demand. The latest surge into overbought conditions marks a shift where traders should monitor for potential consolidation or a reversal, making sustained closes above $82.11 the key confirmation of continued upside momentum.


-
 Afghanistan
-
 Albania
-
 Algeria
-
 Angola
-
 Argentina
-
 Armenia
-
 Australia
-
 Austria
-
 Azerbaijan
-
 Bahamas
-
 Bahrain
-
 Bangladesh
-
 Belarus
-
 Belgium
-
 Bolivia
-
 Botswana
-
 Brazil
-
 Brunei
-
 Bulgaria
-
 Cambodia
-
 Cameroon
-
 Canada
-
 Chile
Chile
-
 China
China
-
 Colombia
-
 Congo
Congo
-
 Costa Rica
-
 Cote d'Ivoire
-
 Croatia
-
 Cuba
Cuba
-
 Cyprus
-
 Czechia
-
 DR Congo
-
 Denmark
-
 Dominican Republic
-
 Ecuador
-
 Egypt
Egypt
-
 El Salvador
-
 Estonia
-
 Eswatini
-
 Ethiopia
-
 Finland
-
 France
-
 Georgia
-
 Germany
-
 Ghana
Ghana
-
 Greece
-
 Haiti
Haiti
-
 Hong Kong
-
 Hungary
-
 India
India
-
 Indonesia
-
 Iran, Islamic republic
-
 Iraq
Iraq
-
 Ireland
-
 Israel
-
 Italy
Italy
-
 Jamaica
-
 Japan
Japan
-
 Jordan
-
 Kazakhstan
-
 Kenya
Kenya
-
 Korea
Korea
-
 Kuwait
-
 Kyrgyzstan
-
 Laos
Laos
-
 Latvia
-
 Lebanon
-
 Lesotho
-
 Libya
Libya
-
 Lithuania
-
 Luxembourg
-
 Madagascar
-
 Malaysia
-
 Malta
Malta
-
 Mauritius
-
 Mexico
-
 Moldova
-
 Mongolia
-
 Montenegro
-
 Morocco
-
 Mozambique
-
 Myanmar
-
 Namibia
-
 Nepal
Nepal
-
 Netherlands
-
 New Zealand
-
 Nigeria
-
 North Macedonia
-
 Norway
-
 Oman
Oman
-
 Pakistan
-
 Palestine
-
 Panama
-
 Papua New Guinea
-
 Paraguay
-
 Peru
Peru
-
 Philippines
-
 Poland
-
 Portugal
-
 Puerto Rico
-
 Qatar
Qatar
-
 Reunion
-
 Romania
-
 Rwanda
-
 Saudi Arabia
-
 Serbia
-
 Singapore
-
 Slovakia
-
 Slovenia
-
 Somalia
-
 South Africa
-
 Spain
Spain
-
 Sri Lanka
-
 Sweden
-
 Switzerland
-
 Syria
Syria
-
 Taiwan
-
 Tajikistan
-
 Tanzania
-
 Thailand
-
 Trinidad and Tobago
-
 Tunisia
-
 Turkey
-
 UAE
UAE
-
 Uganda
-
 Ukraine
-
 United Kingdom
-
United States
-
 Uruguay
-
 Uzbekistan
-
 Venezuela
-
 Vietnam
-
 Yemen
Yemen
-
 Zambia
-
 Zimbabwe
- Forex
- Crypto
