
Texas Instruments stock price forecast: Testing $317.05 resistance as TXN climbs 3.25%

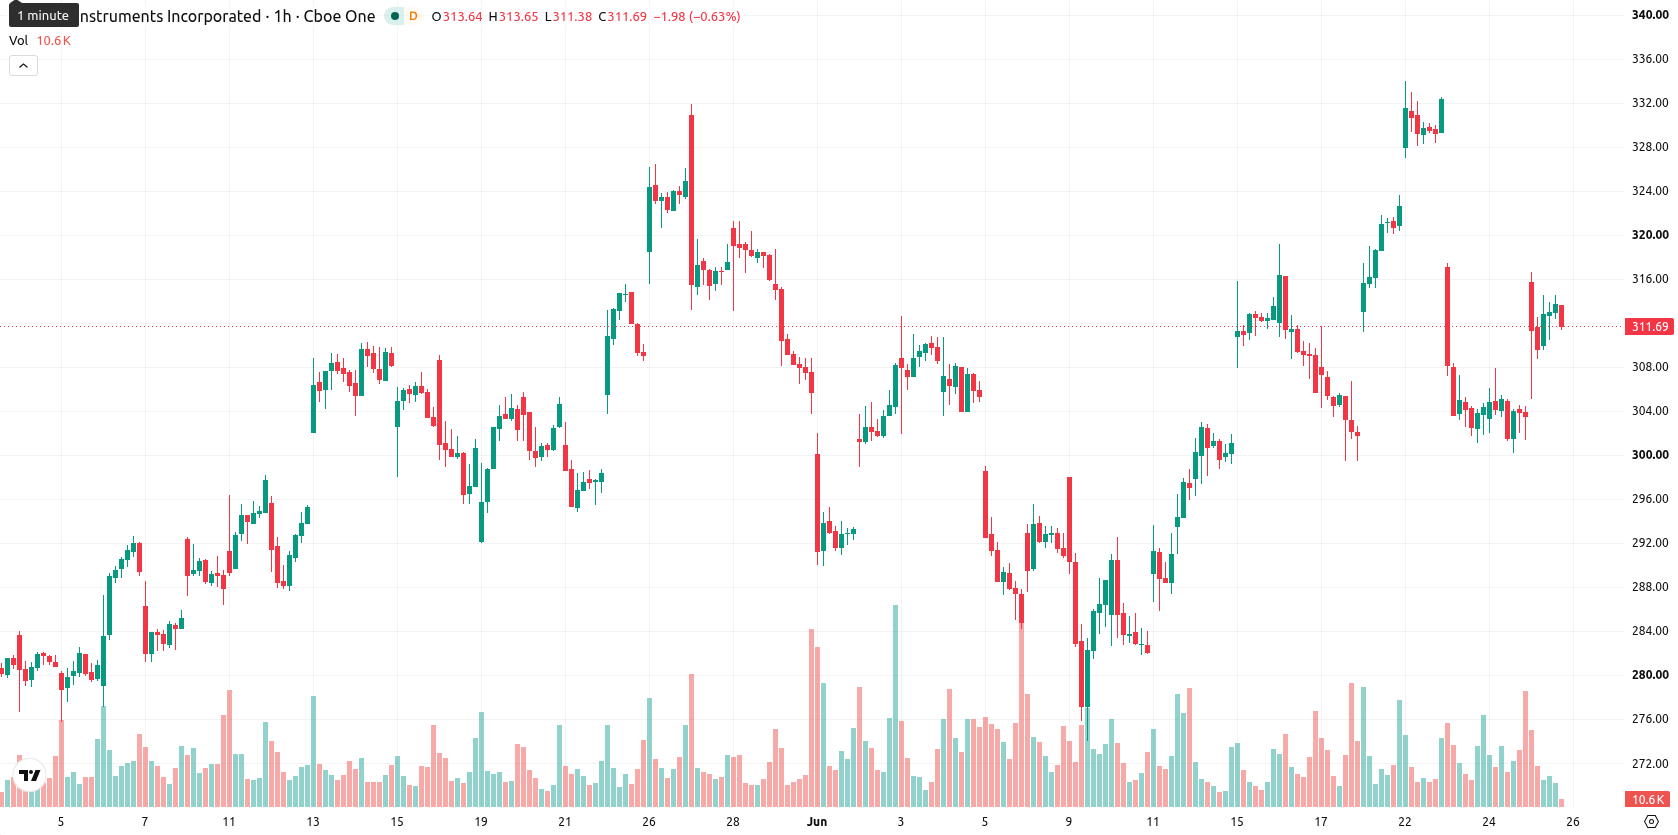
Texas Instruments (TXN) stock is trading at $312.98, reflecting a daily gain of 3.25%. The price is positioned above its key moving averages, highlighting notable strength relative to recent trend levels.
Highlights
- Guyasuta Investment Advisors Inc. trimmed its Texas Instruments stake by 19.9% in Q1, reflecting possible portfolio rebalancing or a revised outlook.
- This institutional adjustment could influence TXN's ownership distribution, liquidity dynamics, and near-term investor sentiment.
- Price action shows strong bullish momentum with a 3.25% intraday jump, elevated volatility, and a 74% probability of consolidating between $297.79 and $328.17.
Institutional unloading shifts ownership profile and impacts sentiment
Guyasuta Investment Advisors Inc. has reduced its holdings in Texas Instruments by 19.9% during the first quarter, which may indicate portfolio rebalancing or a changed view on TXN, according to MarketBeat. Such institutional shifts can affect supply and liquidity in the stock, influencing short-term investor sentiment. The adjustment by a named investor highlights ongoing dynamics in the stock’s ownership profile.
Mixed momentum signals as price tests near-term technical thresholds
On the technical front, TXN shows strong bullish momentum as price remains above the MA-20 at $309.06, MA-50 at $312.08 on the hourly chart, and well above the longer-term MA-200 at $212. The immediate resistance is set by the Ichimoku Kijun at $317.05. Among momentum indicators, the Moving Average Convergence Divergence (MACD) signals a strong sell, while the Average Directional Index (ADX) gives a buy signal and the Relative Strength Index (RSI) prints a reading of 51.88, interpreted as a buy. Stochastic RSI is overbought, the Commodity Channel Index (CCI) is neutral, Bull/Bear Power confirms overbought buyer dominance, and the Awesome Oscillator (AO) remains neutral, indicating mixed signals amid the prevailing up-move.
Upside favored as price targets consolidation within volatility band
In the short term, TXN is expected to consolidate within a volatility band between $297.79 and $328.17. Statistical probabilities favor an upward move with a 74% likelihood, while the chance of a downward correction stands at 26%. The baseline scenario sees TXN holding this corridor; should price break above resistance at $317.05, bullish momentum could accelerate, while a drop below noted support would point to a reversal scenario.
Earlier, analysts noted that Texas Instruments was exhibiting persistent bullish momentum despite signals of caution due to heightened volatility. The current technical and ownership shifts reinforce this outlook, signaling that sustained consolidation above key moving averages could position TXN for a fresh test of its immediate resistance at $317.05 in the sessions ahead.


Latest Texas Instruments News


-
 Afghanistan
-
 Albania
-
 Algeria
-
 Angola
-
 Argentina
-
 Armenia
-
 Australia
-
 Austria
-
 Azerbaijan
-
 Bahamas
-
 Bahrain
-
 Bangladesh
-
 Belarus
-
 Belgium
-
 Bolivia
-
 Botswana
-
 Brazil
-
 Brunei
-
 Bulgaria
-
 Cambodia
-
 Cameroon
-
 Canada
-
 Chile
Chile
-
 China
China
-
 Colombia
-
 Congo
Congo
-
 Costa Rica
-
 Cote d'Ivoire
-
 Croatia
-
 Cuba
Cuba
-
 Cyprus
-
 Czechia
-
 DR Congo
-
 Denmark
-
 Dominican Republic
-
 Ecuador
-
 Egypt
Egypt
-
 El Salvador
-
 Estonia
-
 Eswatini
-
 Ethiopia
-
 Finland
-
 France
-
 Georgia
-
 Germany
-
 Ghana
Ghana
-
 Greece
-
 Haiti
Haiti
-
 Hong Kong
-
 Hungary
-
 India
India
-
 Indonesia
-
 Iran, Islamic republic
-
 Iraq
Iraq
-
 Ireland
-
 Israel
-
 Italy
Italy
-
 Jamaica
-
 Japan
Japan
-
 Jordan
-
 Kazakhstan
-
 Kenya
Kenya
-
 Korea
Korea
-
 Kuwait
-
 Kyrgyzstan
-
 Laos
Laos
-
 Latvia
-
 Lebanon
-
 Lesotho
-
 Libya
Libya
-
 Lithuania
-
 Luxembourg
-
 Madagascar
-
 Malaysia
-
 Malta
Malta
-
 Mauritius
-
 Mexico
-
 Moldova
-
 Mongolia
-
 Montenegro
-
 Morocco
-
 Mozambique
-
 Myanmar
-
 Namibia
-
 Nepal
Nepal
-
 Netherlands
-
 New Zealand
-
 Nigeria
-
 North Macedonia
-
 Norway
-
 Oman
Oman
-
 Pakistan
-
 Palestine
-
 Panama
-
 Papua New Guinea
-
 Paraguay
-
 Peru
Peru
-
 Philippines
-
 Poland
-
 Portugal
-
 Puerto Rico
-
 Qatar
Qatar
-
 Reunion
-
 Romania
-
 Rwanda
-
 Saudi Arabia
-
 Serbia
-
 Singapore
-
 Slovakia
-
 Slovenia
-
 Somalia
-
 South Africa
-
 Spain
Spain
-
 Sri Lanka
-
 Sweden
-
 Switzerland
-
 Syria
Syria
-
 Taiwan
-
 Tajikistan
-
 Tanzania
-
 Thailand
-
 Trinidad and Tobago
-
 Tunisia
-
 Turkey
-
 UAE
UAE
-
 Uganda
-
 Ukraine
-
 United Kingdom
-
United States
-
 Uruguay
-
 Uzbekistan
-
 Venezuela
-
 Vietnam
-
 Yemen
Yemen
-
 Zambia
-
 Zimbabwe
- Forex
- Crypto
