
Lululemon Athletica stock consolidates as summer sale signals margin pressure

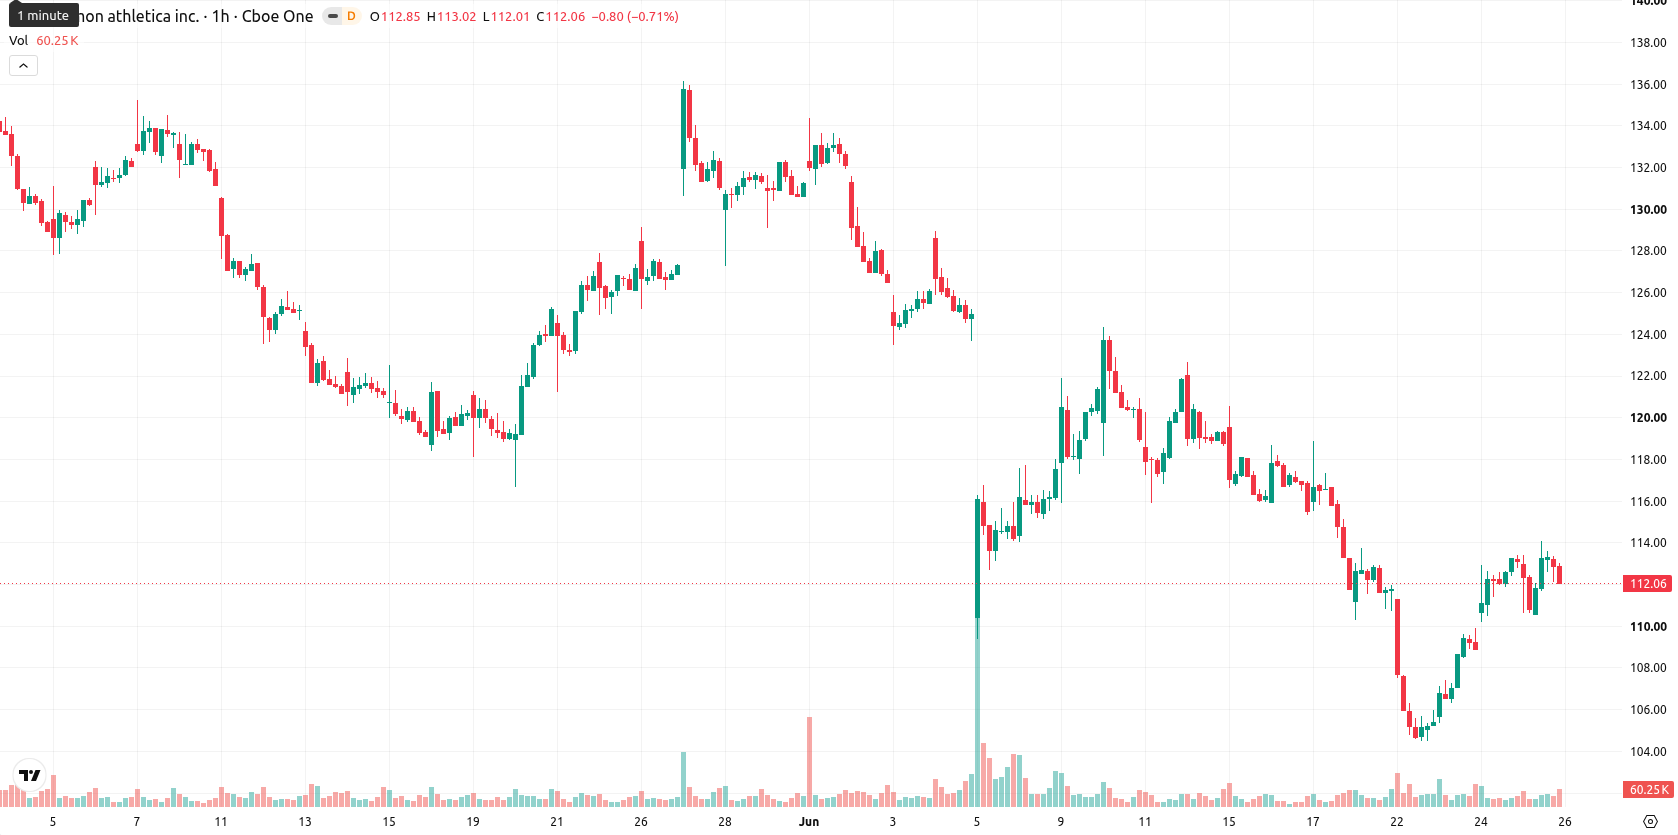
Lululemon Athletica (LULU) stock is trading at $112.06 after a modest decline in the latest session. The price remains above its key short- and medium-term moving averages, reflecting stability over the intraday timeframe.
Highlights
- Lululemon's unusual summer sale introduces major discounts, likely boosting short-term consumer demand and store traffic.
- Aggressive promotional activity reflects mounting competition in retail and could pressure margins for the current period.
- LULU trades in a $108.05–$116.07 range with mixed momentum signals; bearish bias prevails if support at $109.26 breaks.
Short-term demand rises amid deeper promotional discounts
Lululemon Athletica has launched a rare summer sale with significant discounts on selected apparel items, according to Esquire. This event is likely to spur short-term demand and drive increased store and online traffic as consumers respond to promotional pricing. However, the move also highlights a more competitive retail landscape and could affect margin performance for the period.
Mixed momentum emerges as near-term bullish signals face neutral resistance
On the H1 timeframe, LULU is positioned above both the MA-20 at $111.11 and the MA-50 at $111.88, while it remains well below the MA-200 at $166.16. The Ichimoku Kijun offers immediate support at $109.26. Among momentum indicators, the Moving Average Convergence Divergence (MACD) signals a buy, whereas the Average Directional Index (ADX) and Stochastic RSI are neutral. The Relative Strength Index (RSI) reads 52.91 and the Commodity Channel Index (CCI) also reflect buy-side pressure. Bull/Bear Power indicates an overbought setup intraday, and the Awesome Oscillator remains aligned with bullish momentum. This combination reveals a divergence between neutral and bullish signals across key technicals.
Sideways risk dominates as key levels confine price action
Over the coming days, LULU is expected to fluctuate within a range of $108.05 to $116.07, consistent with typical volatility relative to current levels. The baseline scenario calls for ongoing sideways action within this band. The probability of further upside stands at 40%, while there is a 60% likelihood of a downward move. A decisive rally above immediate resistance would open room for further gains, whereas a sustained break below support at $109.26 could trigger a move toward the lower end of the forecasted range.


-
 Afghanistan
-
 Albania
-
 Algeria
-
 Angola
-
 Argentina
-
 Armenia
-
 Australia
-
 Austria
-
 Azerbaijan
-
 Bahamas
-
 Bahrain
-
 Bangladesh
-
 Belarus
-
 Belgium
-
 Bolivia
-
 Botswana
-
 Brazil
-
 Brunei
-
 Bulgaria
-
 Cambodia
-
 Cameroon
-
 Canada
-
 Chile
Chile
-
 China
China
-
 Colombia
-
 Congo
Congo
-
 Costa Rica
-
 Cote d'Ivoire
-
 Croatia
-
 Cuba
Cuba
-
 Cyprus
-
 Czechia
-
 DR Congo
-
 Denmark
-
 Dominican Republic
-
 Ecuador
-
 Egypt
Egypt
-
 El Salvador
-
 Estonia
-
 Eswatini
-
 Ethiopia
-
 Finland
-
 France
-
 Georgia
-
 Germany
-
 Ghana
Ghana
-
 Greece
-
 Haiti
Haiti
-
 Hong Kong
-
 Hungary
-
 India
India
-
 Indonesia
-
 Iran, Islamic republic
-
 Iraq
Iraq
-
 Ireland
-
 Israel
-
 Italy
Italy
-
 Jamaica
-
 Japan
Japan
-
 Jordan
-
 Kazakhstan
-
 Kenya
Kenya
-
 Korea
Korea
-
 Kuwait
-
 Kyrgyzstan
-
 Laos
Laos
-
 Latvia
-
 Lebanon
-
 Lesotho
-
 Libya
Libya
-
 Lithuania
-
 Luxembourg
-
 Madagascar
-
 Malaysia
-
 Malta
Malta
-
 Mauritius
-
 Mexico
-
 Moldova
-
 Mongolia
-
 Montenegro
-
 Morocco
-
 Mozambique
-
 Myanmar
-
 Namibia
-
 Nepal
Nepal
-
 Netherlands
-
 New Zealand
-
 Nigeria
-
 North Macedonia
-
 Norway
-
 Oman
Oman
-
 Pakistan
-
 Palestine
-
 Panama
-
 Papua New Guinea
-
 Paraguay
-
 Peru
Peru
-
 Philippines
-
 Poland
-
 Portugal
-
 Puerto Rico
-
 Qatar
Qatar
-
 Reunion
-
 Romania
-
 Rwanda
-
 Saudi Arabia
-
 Serbia
-
 Singapore
-
 Slovakia
-
 Slovenia
-
 Somalia
-
 South Africa
-
 Spain
Spain
-
 Sri Lanka
-
 Sweden
-
 Switzerland
-
 Syria
Syria
-
 Taiwan
-
 Tajikistan
-
 Tanzania
-
 Thailand
-
 Trinidad and Tobago
-
 Tunisia
-
 Turkey
-
 UAE
UAE
-
 Uganda
-
 Ukraine
-
 United Kingdom
-
United States
-
 Uruguay
-
 Uzbekistan
-
 Venezuela
-
 Vietnam
-
 Yemen
Yemen
-
 Zambia
-
 Zimbabwe
- Forex
- Crypto
