

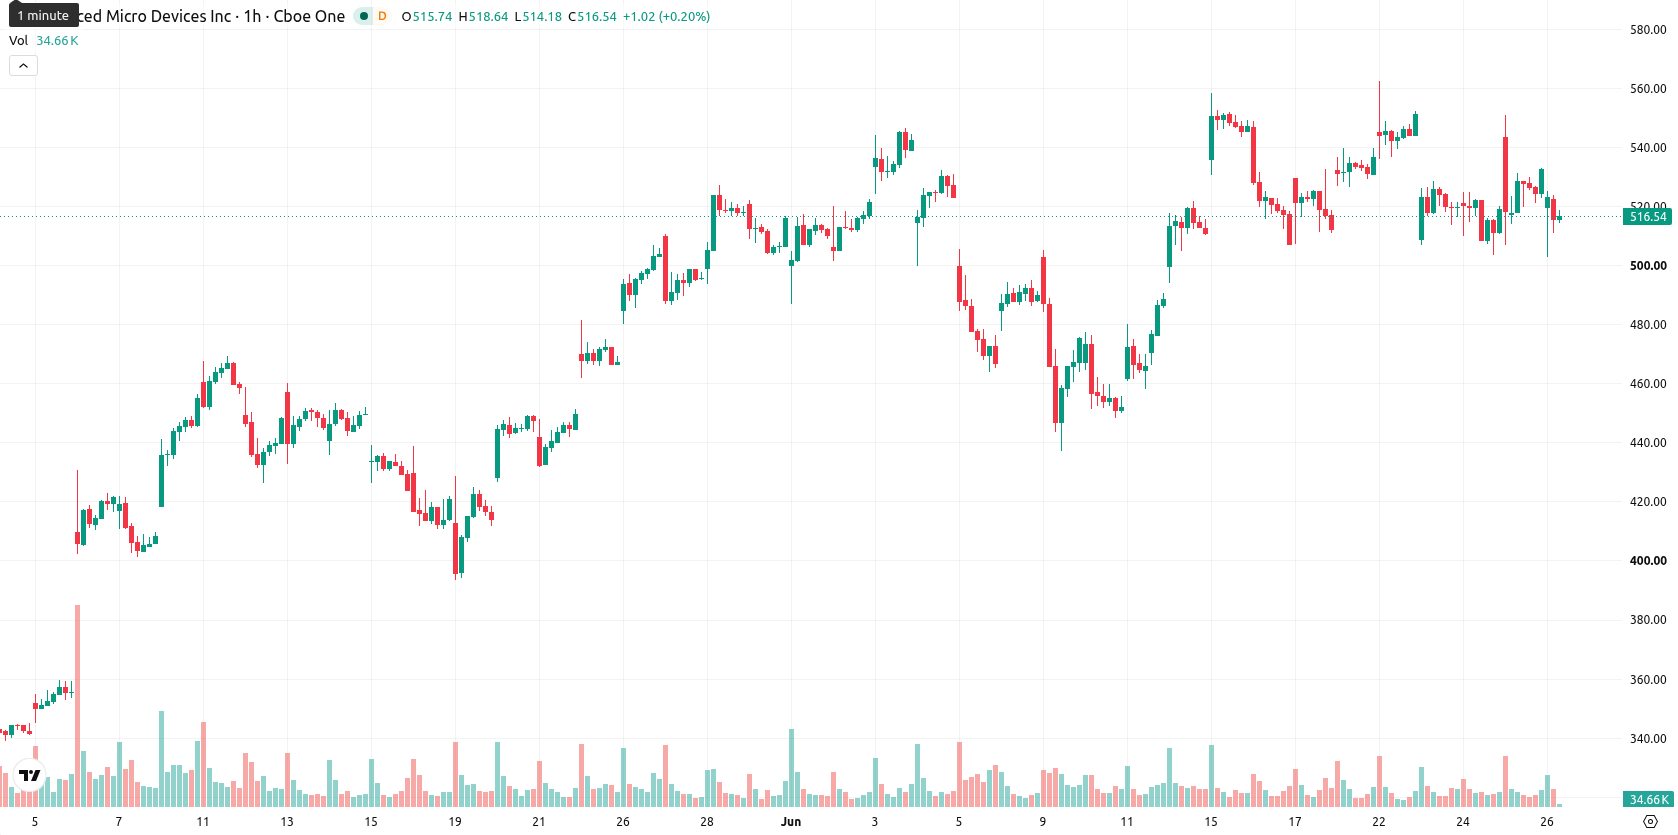
Advanced Micro Devices, Inc. (AMD) stock is trading at $516.67, marking a daily decline of 3.15%. The price is positioned below its short- and medium-term moving averages, indicating ongoing selling pressure, though it remains supported at longer timeframes.
Highlights
- Investor concern over potential weakness in chip demand has intensified as higher prices for Apple and Xbox products hint at downstream consumer risk.
- AMD faces heightened sensitivity to earnings forecasts due to its rich forward earnings multiple of 97, raising valuation risk in uncertain demand conditions.
- Technical signals are broadly bearish, with AMD/USD likely to trade between $490.07 and $544.32 over the next 2–3 days amid continued selling pressure.
Demand jitters and valuation risks intensify sector-specific pressure
Investor anxiety over a potential downturn in chip demand has intensified, as price hikes for Apple and Xbox products raise concerns about downstream consumption for semiconductor components, according to Gurufocus. This apprehension has pressured AMD specifically, as expectations for near-term revenue become more uncertain in light of broad demand risks. The company's elevated forward earnings multiple of 97, as reported by Fool, further amplifies market sensitivity with participants wary of valuation risk under current conditions.
Negative momentum and oversold signals amid wide technical gap
On the hourly chart, AMD trades below the 20-period moving average at $521.41 and the 50-period moving average at $525.57. On the daily timeframe, the price remains well above the 200-period moving average at $268.62, confirming a wide gap between short-term weakness and long-term support. The Ichimoku Kijun level at $527.63 serves as immediate resistance. Momentum signals are decisively negative, with the Moving Average Convergence Divergence (MACD) indicating a strong sell, the Average Directional Index (ADX) showing a neutral trend, and the Relative Strength Index (RSI) reading at a weak 44.02. Both Stochastic RSI and the Commodity Channel Index (CCI) register as strong sell and oversold, respectively, while Bull/Bear Power points to seller dominance and an oversold condition. The Awesome Oscillator is neutral, offering no additional bias.
Range-bound outlook as downside risk outweighs recovery potential
Over the next two to three trading days, AMD is likely to remain within a broad volatility band between $490.07 and $544.32. There is a 29% probability of an upward move, while a down scenario is more likely at 71%. The baseline outlook calls for range-bound action unless the price can break above the immediate resistance level, which would open the way for a short-term recovery. Conversely, a breach below the established support area would reinforce downside momentum and extend recent losses.
Earlier, analysts noted that elevated valuations and the risk of profit-taking could limit near-term upside for AMD as investor sentiment becomes more cautious. Now, with market signals pointing decisively negative and downside momentum accelerating, traders should monitor the $490 area as a key support level that could determine whether further declines materialize in the short term.


Latest AMD News


-
 Afghanistan
-
 Albania
-
 Algeria
-
 Angola
-
 Argentina
-
 Armenia
-
 Australia
-
 Austria
-
 Azerbaijan
-
 Bahamas
-
 Bahrain
-
 Bangladesh
-
 Belarus
-
 Belgium
-
 Bolivia
-
 Botswana
-
 Brazil
-
 Brunei
-
 Bulgaria
-
 Cambodia
-
 Cameroon
-
 Canada
-
 Chile
Chile
-
 China
China
-
 Colombia
-
 Congo
Congo
-
 Costa Rica
-
 Cote d'Ivoire
-
 Croatia
-
 Cuba
Cuba
-
 Cyprus
-
 Czechia
-
 DR Congo
-
 Denmark
-
 Dominican Republic
-
 Ecuador
-
 Egypt
Egypt
-
 El Salvador
-
 Estonia
-
 Eswatini
-
 Ethiopia
-
 Finland
-
 France
-
 Georgia
-
 Germany
-
 Ghana
Ghana
-
 Greece
-
 Haiti
Haiti
-
 Hong Kong
-
 Hungary
-
 India
India
-
 Indonesia
-
 Iran, Islamic republic
-
 Iraq
Iraq
-
 Ireland
-
 Israel
-
 Italy
Italy
-
 Jamaica
-
 Japan
Japan
-
 Jordan
-
 Kazakhstan
-
 Kenya
Kenya
-
 Korea
Korea
-
 Kuwait
-
 Kyrgyzstan
-
 Laos
Laos
-
 Latvia
-
 Lebanon
-
 Lesotho
-
 Libya
Libya
-
 Lithuania
-
 Luxembourg
-
 Madagascar
-
 Malaysia
-
 Malta
Malta
-
 Mauritius
-
 Mexico
-
 Moldova
-
 Mongolia
-
 Montenegro
-
 Morocco
-
 Mozambique
-
 Myanmar
-
 Namibia
-
 Nepal
Nepal
-
 Netherlands
-
 New Zealand
-
 Nigeria
-
 North Macedonia
-
 Norway
-
 Oman
Oman
-
 Pakistan
-
 Palestine
-
 Panama
-
 Papua New Guinea
-
 Paraguay
-
 Peru
Peru
-
 Philippines
-
 Poland
-
 Portugal
-
 Puerto Rico
-
 Qatar
Qatar
-
 Reunion
-
 Romania
-
 Rwanda
-
 Saudi Arabia
-
 Serbia
-
 Singapore
-
 Slovakia
-
 Slovenia
-
 Somalia
-
 South Africa
-
 Spain
Spain
-
 Sri Lanka
-
 Sweden
-
 Switzerland
-
 Syria
Syria
-
 Taiwan
-
 Tajikistan
-
 Tanzania
-
 Thailand
-
 Trinidad and Tobago
-
 Tunisia
-
 Turkey
-
 UAE
UAE
-
 Uganda
-
 Ukraine
-
 United Kingdom
-
United States
-
 Uruguay
-
 Uzbekistan
-
 Venezuela
-
 Vietnam
-
 Yemen
Yemen
-
 Zambia
-
 Zimbabwe
- Forex
- Crypto
