
SoFi stock price forecast: Trading in the $17.07–$18.59 range as SOFI rises 3.06%

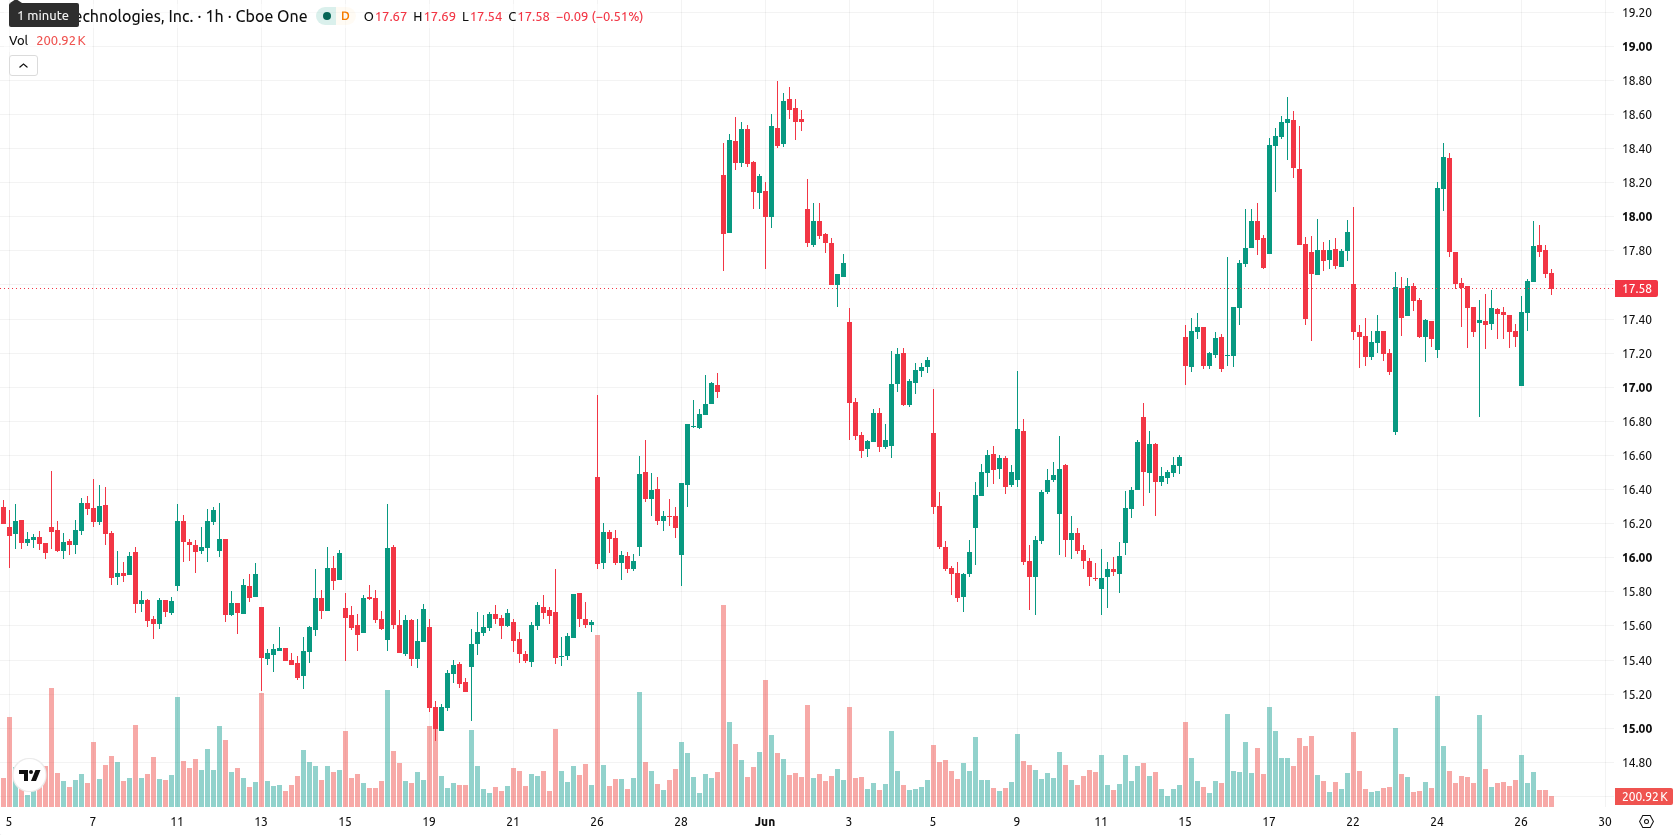
SoFi (SOFI) stock is trading at $17.83, up 3.06% for the session. The price stands above its short- and medium-term moving averages but remains below longer-term trend marks.
Highlights
- SoFi launched a digital HELOC product, broadening its lending portfolio and aiming to boost borrower activity and interest income.
- Recent financials show SoFi generated $3.58 billion in trailing twelve-month revenue and achieved a 13.4% profit margin, reflecting strong operational leverage.
- SOFI exhibits strong short-term bullish momentum and is projected to trade between $17.07 and $18.59, with a high probability of further upside.
Expanded lending as HELOC launch and capital raise boost capacity
SoFi’s rollout of a new digital home equity line of credit (HELOC) product on June 25, 2026, expands its lending capabilities and is positioned to drive incremental borrower activity and interest income. Recent figures show SoFi achieved trailing twelve months revenue of $3.58 billion and net income of $481 million, reflecting a 13.4% profit margin, according to Tickeron, which reinforces the company’s operational leverage as its product suite grows. Additionally, completion of a $1.5 billion capital raise has improved balance sheet strength and gives SoFi scope to support further growth and absorb market-driven shocks. Ongoing deposit growth, including $40.24 billion in total deposits and 95% of its $42.17 billion loan book now funded by deposits as reported by News Alphastreet, enhances resilience and supports the company’s expansion strategy.
Intraday upside momentum as buyers test resistance zones
On the technical side, SOFI is trading above the 20- and 50-period moving averages on the hourly chart, but remains below the 200-period moving average on the daily timeframe. The Ichimoku Kijun marks immediate support at $17.58. The Relative Strength Index (RSI) and Commodity Channel Index (CCI) both register buy signals, while the Stochastic RSI is overbought and Bull/Bear Power indicates buyers are dominating intraday momentum. The Moving Average Convergence Divergence (MACD) and Average Directional Index (ADX) are neutral; the Awesome Oscillator signals strong upside amid intraday volatility.
Range-bound outlook as breakout risk defines near-term direction
Looking ahead, SOFI is expected to trade within a projected range of $17.07 to $18.59 over the next several days. The baseline scenario is for price to consolidate within this band. A move above the upper range boundary would signal an extension of the current uptrend, while a fall below $17.07 would introduce renewed selling pressure and weaken the short-term outlook.
Previously it was reported that SoFi’s strong product launches and executive buying were fueling investor optimism and reinforcing the case for further gains in the stock. The recent expansion into home equity lending, solid revenue growth, and an enhanced capital position add a new layer of fundamental support, with traders now watching for a decisive move outside the $17.07 to $18.59 range as a signal for the next trend.


-
 Afghanistan
-
 Albania
-
 Algeria
-
 Angola
-
 Argentina
-
 Armenia
-
 Australia
-
 Austria
-
 Azerbaijan
-
 Bahamas
-
 Bahrain
-
 Bangladesh
-
 Belarus
-
 Belgium
-
 Bolivia
-
 Botswana
-
 Brazil
-
 Brunei
-
 Bulgaria
-
 Cambodia
-
 Cameroon
-
 Canada
-
 Chile
Chile
-
 China
China
-
 Colombia
-
 Congo
Congo
-
 Costa Rica
-
 Cote d'Ivoire
-
 Croatia
-
 Cuba
Cuba
-
 Cyprus
-
 Czechia
-
 DR Congo
-
 Denmark
-
 Dominican Republic
-
 Ecuador
-
 Egypt
Egypt
-
 El Salvador
-
 Estonia
-
 Eswatini
-
 Ethiopia
-
 Finland
-
 France
-
 Georgia
-
 Germany
-
 Ghana
Ghana
-
 Greece
-
 Haiti
Haiti
-
 Hong Kong
-
 Hungary
-
 India
India
-
 Indonesia
-
 Iran, Islamic republic
-
 Iraq
Iraq
-
 Ireland
-
 Israel
-
 Italy
Italy
-
 Jamaica
-
 Japan
Japan
-
 Jordan
-
 Kazakhstan
-
 Kenya
Kenya
-
 Korea
Korea
-
 Kuwait
-
 Kyrgyzstan
-
 Laos
Laos
-
 Latvia
-
 Lebanon
-
 Lesotho
-
 Libya
Libya
-
 Lithuania
-
 Luxembourg
-
 Madagascar
-
 Malaysia
-
 Malta
Malta
-
 Mauritius
-
 Mexico
-
 Moldova
-
 Mongolia
-
 Montenegro
-
 Morocco
-
 Mozambique
-
 Myanmar
-
 Namibia
-
 Nepal
Nepal
-
 Netherlands
-
 New Zealand
-
 Nigeria
-
 North Macedonia
-
 Norway
-
 Oman
Oman
-
 Pakistan
-
 Palestine
-
 Panama
-
 Papua New Guinea
-
 Paraguay
-
 Peru
Peru
-
 Philippines
-
 Poland
-
 Portugal
-
 Puerto Rico
-
 Qatar
Qatar
-
 Reunion
-
 Romania
-
 Rwanda
-
 Saudi Arabia
-
 Serbia
-
 Singapore
-
 Slovakia
-
 Slovenia
-
 Somalia
-
 South Africa
-
 Spain
Spain
-
 Sri Lanka
-
 Sweden
-
 Switzerland
-
 Syria
Syria
-
 Taiwan
-
 Tajikistan
-
 Tanzania
-
 Thailand
-
 Trinidad and Tobago
-
 Tunisia
-
 Turkey
-
 UAE
UAE
-
 Uganda
-
 Ukraine
-
 United Kingdom
-
United States
-
 Uruguay
-
 Uzbekistan
-
 Venezuela
-
 Vietnam
-
 Yemen
Yemen
-
 Zambia
-
 Zimbabwe
- Forex
- Crypto
