

Comcast stock jumps 8.83% as NBCUniversal and Sky spinoffs create two public companies

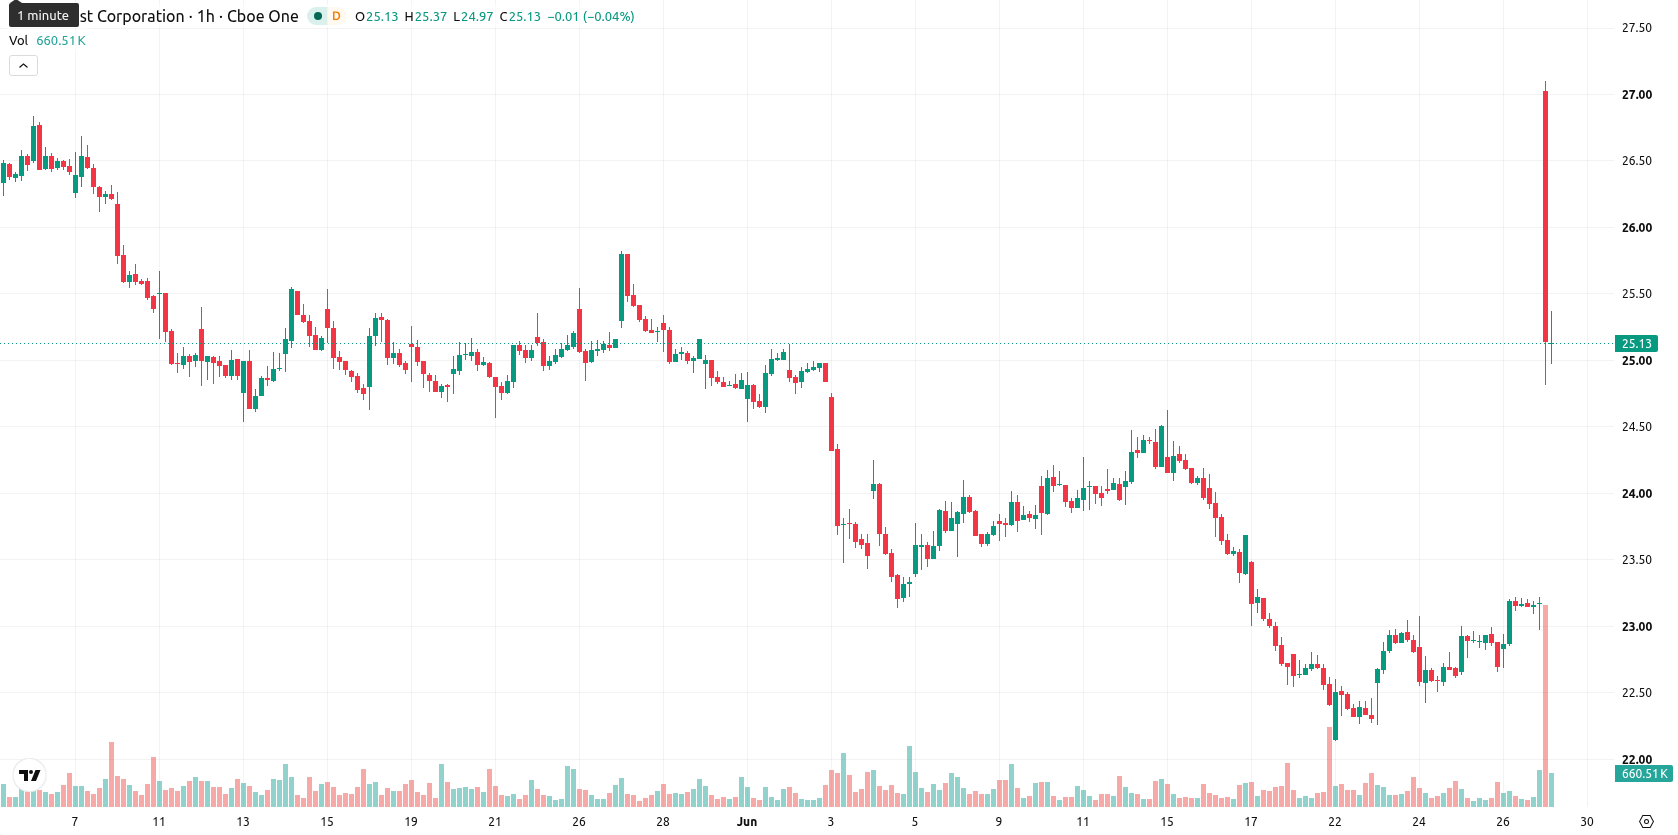
Comcast (CMCSA) stock is trading at $25.22, up 8.83% on the day. The price stands above its key moving averages, signaling near-term strength amid an active session.
 22.32
22.32
Highlights
- Comcast will split into two independent public companies, spinning off NBCUniversal and Sky to unlock shareholder value.
- Leadership transitions will see Mike Cavanagh head NBCUniversal and Michael Angelakis lead Comcast following the separation, pending approvals in about a year.
- CMCSA surged 8.83% but displays extreme overbought signals; near-term range expected between $23.16 and $25.66 with high volatility.
Breakup plan spurs value rotation as Comcast splits core businesses
Comcast has unveiled a major restructuring by announcing plans to split into two independent publicly traded companies, spinning off NBCUniversal and Sky through a tax-free transaction, according to Businesswire. This corporate breakup directly addresses investor demand for unlocking value across Comcast's business units and has served as a catalyst for significant repositioning in the stock. The process is expected to take about a year pending final board and regulatory approvals, while transition plans designate Mike Cavanagh as CEO of NBCUniversal and Michael Angelakis as CEO of Comcast post-separation, as reported by Hollywoodreporter.
Buyer dominance as overbought signals and volatility define momentum
On the technical side, CMCSA recently crossed above its 20-period and 50-period moving averages on the H1 chart, with price still trading below the 200-period moving average. The Ichimoku Kijun is situated at $24.62, acting as immediate support. Relative Strength Index (RSI) stands at 91.49, and readings from the Stochastic RSI, Commodity Channel Index (CCI), and Bull/Bear Power all indicate overbought conditions. The Moving Average Convergence Divergence (MACD) and Average Directional Index (ADX) both indicate persistent buying interest, while the Awesome Oscillator is neutral. This set of indicators highlights extreme intraday buyer dominance amid heightened volatility and a stretch in momentum.
Upside potential faces risk of pullback amid post-breakout pause
In the coming sessions, CMCSA is likely to trade within a $23.16 to $25.66 range, reflecting a volatility band relative to current levels. There is a 79% probability of an upward extension if buyers maintain pressure, though a corrective pullback remains possible if the price falls below support at $24.62. Consolidation within this band would indicate the market is pausing to absorb recent developments and price action.
Earlier, analysts noted that Comcast shares faced sustained bearish momentum despite efforts to expand operational segments and attract investors. The latest surge following the announced corporate breakup signals a material shift in sentiment, with traders now watching for potential consolidation as the market digests structural changes and elevated volatility.









-
 Afghanistan
-
 Albania
-
 Algeria
-
 Angola
-
 Argentina
-
 Armenia
-
 Australia
-
 Austria
-
 Azerbaijan
-
 Bahamas
-
 Bahrain
-
 Bangladesh
-
 Belarus
-
 Belgium
-
 Bolivia
-
 Botswana
-
 Brazil
-
 Brunei
-
 Bulgaria
-
 Cambodia
-
 Cameroon
-
 Canada
-
 Chile
-
 China
-
 Colombia
-
 Congo
-
 Costa Rica
-
 Cote d'Ivoire
-
 Croatia
-
 Cuba
-
 Cyprus
-
 Czechia
-
 DR Congo
-
 Denmark
-
 Dominican Republic
-
 Ecuador
-
 Egypt
-
 El Salvador
-
 Estonia
-
 Eswatini
-
 Ethiopia
-
 Finland
-
 France
-
 Georgia
-
 Germany
-
 Ghana
-
 Greece
-
 Haiti
-
 Hong Kong
-
 Hungary
-
 India
-
 Indonesia
-
 Iran, Islamic republic
-
 Iraq
-
 Ireland
-
 Israel
-
 Italy
-
 Jamaica
-
 Japan
-
 Jordan
-
 Kazakhstan
-
 Kenya
-
 Korea
-
 Kuwait
-
 Kyrgyzstan
-
 Laos
-
 Latvia
-
 Lebanon
-
 Lesotho
-
 Libya
-
 Lithuania
-
 Luxembourg
-
 Madagascar
-
 Malaysia
-
 Malta
-
 Mauritius
-
 Mexico
-
 Moldova
-
 Mongolia
-
 Montenegro
-
 Morocco
-
 Mozambique
-
 Myanmar
-
 Namibia
-
 Nepal
-
 Netherlands
-
 New Zealand
-
 Nigeria
-
 North Macedonia
-
 Norway
-
 Oman
-
 Pakistan
-
 Palestine
-
 Panama
-
 Papua New Guinea
-
 Paraguay
-
 Peru
-
 Philippines
-
 Poland
-
 Portugal
-
 Puerto Rico
-
 Qatar
-
 Reunion
-
 Romania
-
 Rwanda
-
 Saudi Arabia
-
 Serbia
-
 Singapore
-
 Slovakia
-
 Slovenia
-
 Somalia
-
 South Africa
-
 Spain
-
 Sri Lanka
-
 Sweden
-
 Switzerland
-
 Syria
-
 Taiwan
-
 Tajikistan
-
 Tanzania
-
 Thailand
-
 Trinidad and Tobago
-
 Tunisia
-
 Turkey
-
 UAE
-
 Uganda
-
 Ukraine
-
 United Kingdom
-
United States
-
 Uruguay
-
 Uzbekistan
-
 Venezuela
-
 Vietnam
-
 Yemen
-
 Zambia
-
 Zimbabwe
- Forex
- Crypto












