
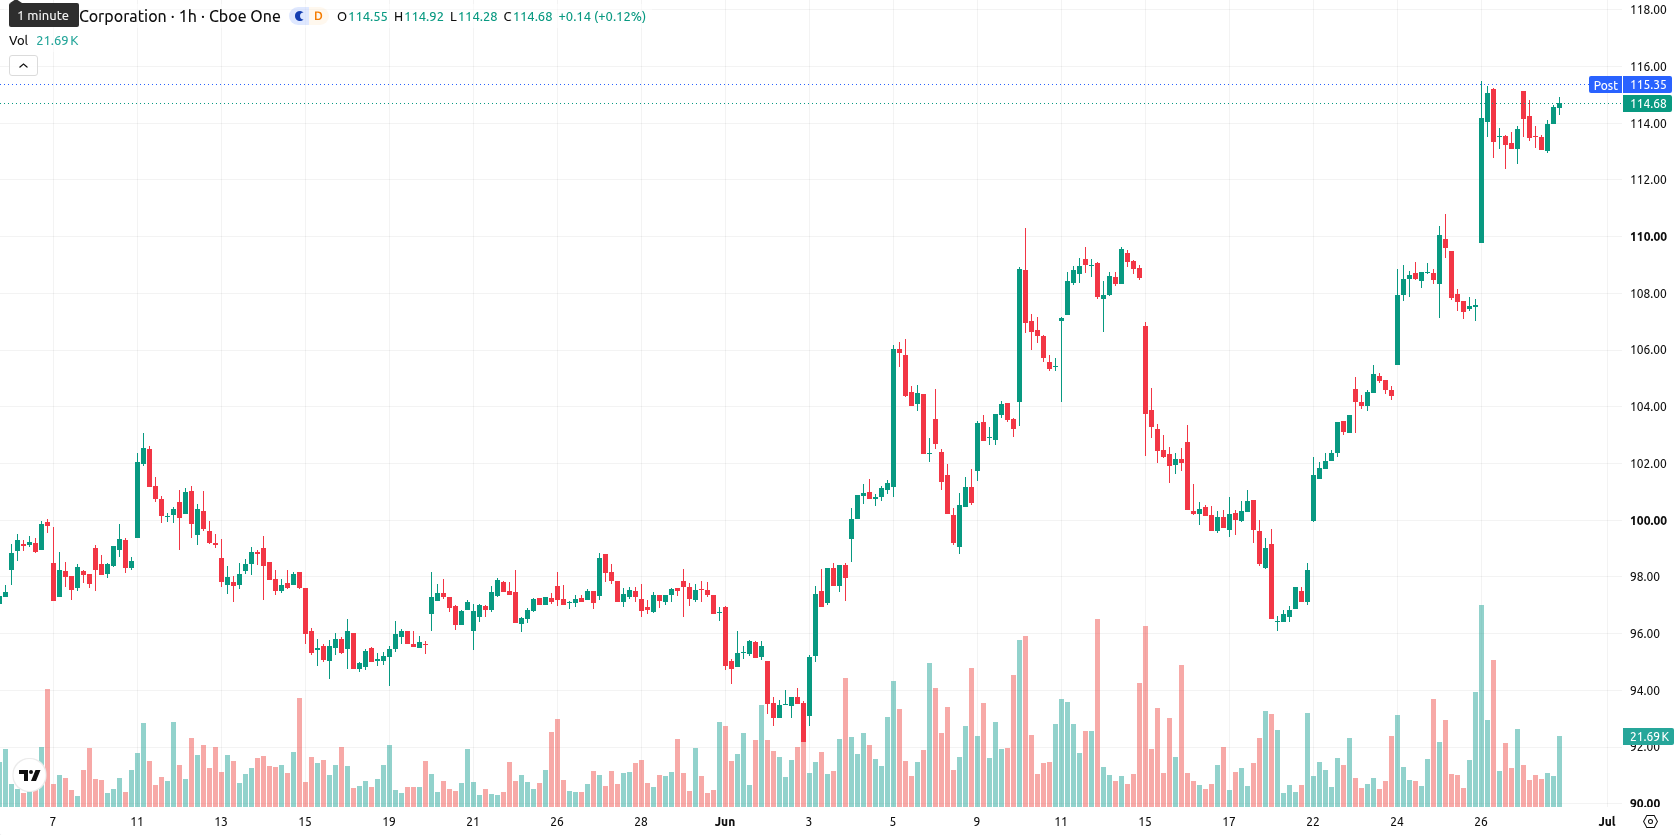
Incyte stock price forecast: $119.67 resistance in focus as INCY trades sideways

Incyte (INCY) stock is trading at $114.2 in the latest session, posting a modest gain for the day. The stock remains above its key moving averages, signaling sustained momentum over recent periods.
Highlights
- Opzelura received a positive CHMP opinion in Europe, unlocking new regional markets and supporting revenue diversification for Incyte.
- The acquisition of Vega Therapeutics strengthens Incyte's pipeline and reduces reliance on Jakafi, bolstering long-term resilience.
- INCY/USD exhibits a strong bullish structure with immediate support at $111.24 and a projected trading range of $108.73 to $119.67, favoring further upside in the near term despite emerging overbought signals.
Regulatory win and acquisition boost outlook as diversification advances
A recent key event for Incyte came with the positive opinion for Opzelura from the Committee for Medicinal Products for Human Use (CHMP) in Europe, opening new market opportunities and paving the way for increased product uptake, as highlighted by Seeking Alpha. This regulatory endorsement marks a critical milestone that can expand access to Opzelura and diversify Incyte's geographic revenue base. Additionally, the completed acquisition of Vega Therapeutics strengthens the company's pipeline and reduces its dependency on Jakafi, enhancing long-term business resilience.
Bullish momentum persists as mixed indicators flag overbought risk
On the hourly chart, INCY is positioned above the MA-20 at $111.83 and MA-50 at $106.47, while on the daily timeframe it trades well above the long-term MA-200 at $97.33. Support is identified at the Ichimoku Kijun level of $111.24. Moving Average Convergence Divergence (MACD) indicates strong buy momentum, confirmed by an elevated Average Directional Index (ADX). The Relative Strength Index (RSI) stands at 67.29, suggesting ongoing buying interest though nearing overbought levels. The Stochastic RSI is producing a sell indication, while the Commodity Channel Index (CCI) continues to support a buy. Bull/Bear Power points to overbought conditions, and the Awesome Oscillator remains neutral, reflecting a mixed but still overall buyer-dominated session.
Sideways trading expected as breakout and downside risks converge
Over the next two to three trading days, INCY is forecast to fluctuate within a range of $108.73 to $119.67, reflecting the asset's typical volatility band relative to current levels. The most probable scenario is sideways movement within this corridor, with a very high probability assigned to an upward move above the current resistance band. If price breaks above $119.67, additional upside could develop, while a drop below $108.73 would represent a risk scenario and may attract additional selling.
Earlier, analysts noted that Incyte's stock was displaying a bullish bias supported by strong technical and momentum signals. The latest developments—ranging from regulatory progress for Opzelura to ongoing technical strength—reinforce the upward trend, making a breakout above $119.67 the key level to watch for potential further gains in the near term.


-
 Afghanistan
-
 Albania
-
 Algeria
-
 Angola
-
 Argentina
-
 Armenia
-
 Australia
-
 Austria
-
 Azerbaijan
-
 Bahamas
-
 Bahrain
-
 Bangladesh
-
 Belarus
-
 Belgium
-
 Bolivia
-
 Botswana
-
 Brazil
-
 Brunei
-
 Bulgaria
-
 Cambodia
-
 Cameroon
-
 Canada
-
 Chile
Chile
-
 China
China
-
 Colombia
-
 Congo
Congo
-
 Costa Rica
-
 Cote d'Ivoire
-
 Croatia
-
 Cuba
Cuba
-
 Cyprus
-
 Czechia
-
 DR Congo
-
 Denmark
-
 Dominican Republic
-
 Ecuador
-
 Egypt
Egypt
-
 El Salvador
-
 Estonia
-
 Eswatini
-
 Ethiopia
-
 Finland
-
 France
-
 Georgia
-
 Germany
-
 Ghana
Ghana
-
 Greece
-
 Haiti
Haiti
-
 Hong Kong
-
 Hungary
-
 India
India
-
 Indonesia
-
 Iran, Islamic republic
-
 Iraq
Iraq
-
 Ireland
-
 Israel
-
 Italy
Italy
-
 Jamaica
-
 Japan
Japan
-
 Jordan
-
 Kazakhstan
-
 Kenya
Kenya
-
 Korea
Korea
-
 Kuwait
-
 Kyrgyzstan
-
 Laos
Laos
-
 Latvia
-
 Lebanon
-
 Lesotho
-
 Libya
Libya
-
 Lithuania
-
 Luxembourg
-
 Madagascar
-
 Malaysia
-
 Malta
Malta
-
 Mauritius
-
 Mexico
-
 Moldova
-
 Mongolia
-
 Montenegro
-
 Morocco
-
 Mozambique
-
 Myanmar
-
 Namibia
-
 Nepal
Nepal
-
 Netherlands
-
 New Zealand
-
 Nigeria
-
 North Macedonia
-
 Norway
-
 Oman
Oman
-
 Pakistan
-
 Palestine
-
 Panama
-
 Papua New Guinea
-
 Paraguay
-
 Peru
Peru
-
 Philippines
-
 Poland
-
 Portugal
-
 Puerto Rico
-
 Qatar
Qatar
-
 Reunion
-
 Romania
-
 Rwanda
-
 Saudi Arabia
-
 Serbia
-
 Singapore
-
 Slovakia
-
 Slovenia
-
 Somalia
-
 South Africa
-
 Spain
Spain
-
 Sri Lanka
-
 Sweden
-
 Switzerland
-
 Syria
Syria
-
 Taiwan
-
 Tajikistan
-
 Tanzania
-
 Thailand
-
 Trinidad and Tobago
-
 Tunisia
-
 Turkey
-
 UAE
UAE
-
 Uganda
-
 Ukraine
-
 United Kingdom
-
United States
-
 Uruguay
-
 Uzbekistan
-
 Venezuela
-
 Vietnam
-
 Yemen
Yemen
-
 Zambia
-
 Zimbabwe
- Forex
- Crypto
