
Meta stock price forecast: $555.56 support in focus as META trades down

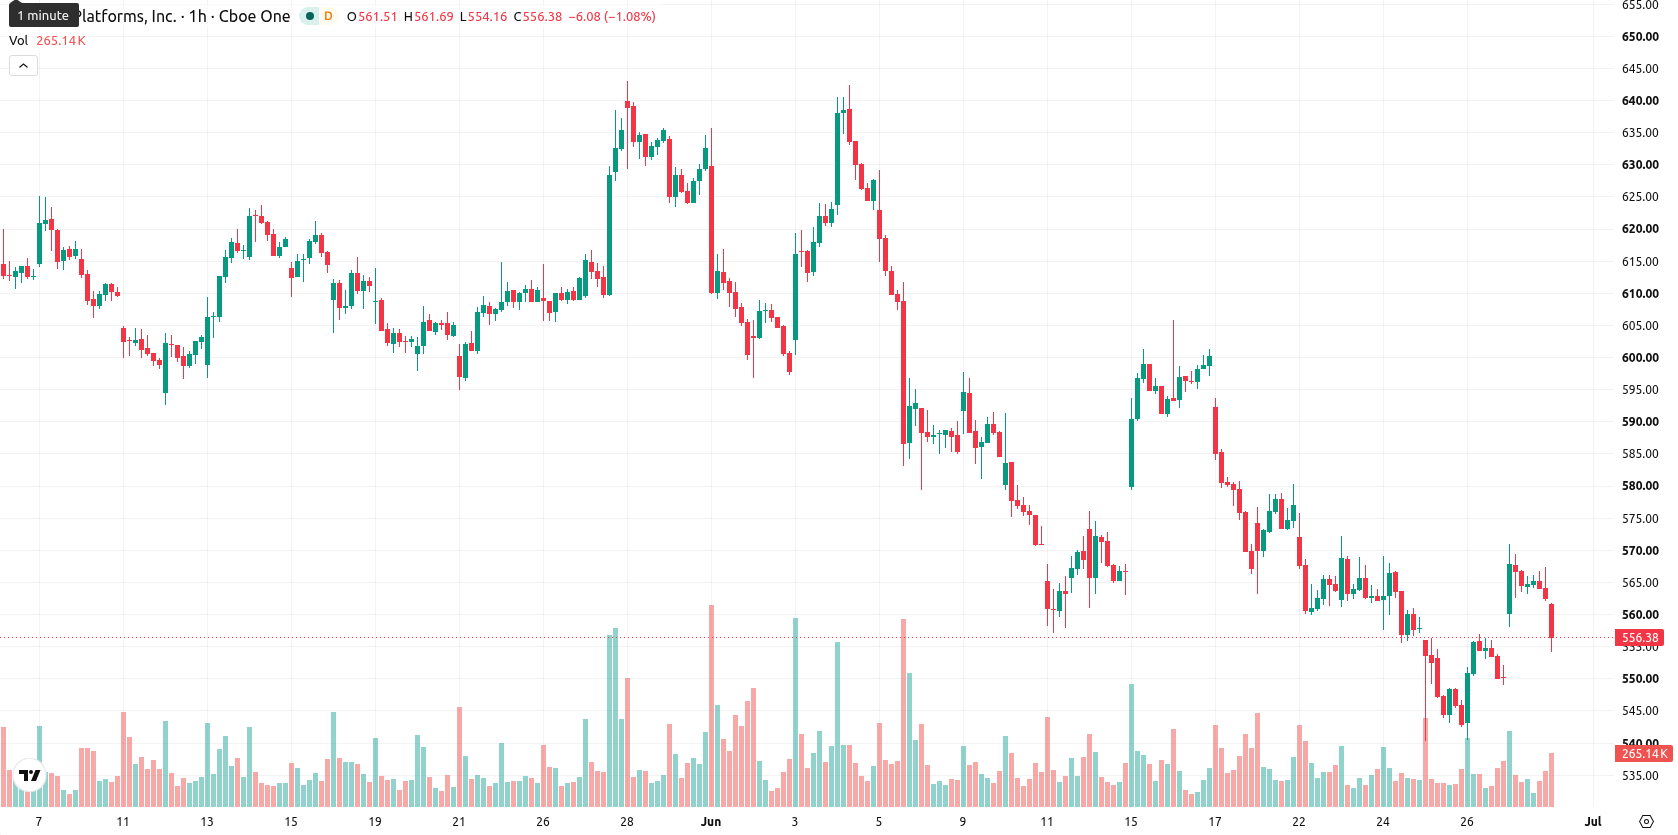
Meta (META) stock is trading at $556.00, marking a daily decline of 1.26%. The price holds above its key moving averages but remains below medium- and long-term averages, reflecting a short-term resilient position within a generally bearish broader trend.
Highlights
- Meta's ongoing share buybacks and $2.10 annualized dividend underpin shareholder value and support per-share metrics.
- Investor optimism around Meta’s AI monetization prospects supports a positive long-term outlook despite recent selling pressure.
- Technical indicators are mixed with short-term resilience, but price is range-bound between $542.3 and $569.7 amid overbought signals and medium-term bearish structure.
Buybacks and dividends sustain sentiment amid persistent selling pressure
Meta's ongoing share buybacks serve to reduce the company's publicly traded float and directly support per-share metrics, as highlighted by Ca Finance Yahoo. The most recent ex-dividend date on June 15 provides investors with a stable annualized dividend payout of $2.10 per share, which helps maintain the appeal of the stock for income-focused holders. Confidence in Meta's AI monetization efforts also underpins a positive long-term outlook for the business, though price action has remained under broader selling pressure.
Mixed momentum as support holds above short-term moving average
META trades above the MA-20 level at $555.17 while remaining below both the MA-50 at $561.04 and the MA-200 at $649.06. Immediate support is identified at the Ichimoku Kijun level of $555.56, and near-term volatility is moderate. Momentum indicators are mixed: the Moving Average Convergence Divergence (MACD) shows a buy signal whereas the Average Directional Index (ADX) is neutral, suggesting unclear directional strength. The Relative Strength Index (RSI) and Commodity Channel Index (CCI) both display bullish tendencies, while the Stochastic RSI is neutral and Bull/Bear Power flags an overbought state that could signal exhausted intraday buyer pressure. The Awesome Oscillator (AO) also reads neutral, painting a backdrop of mixed momentum and limited immediate upside.
Sideways outlook as upside hinges on resistance breakout
For the next two to three trading days, the expected price range for META is between $542.3 and $569.7, reflecting a typical volatility band relative to current levels. An upward move has a 53% probability, making a downside scenario somewhat less likely, but the baseline expectation is sideways price action. Sustained bullish momentum would require a breakout above immediate resistance, while renewed selling pressure could drive the price below key support.
Earlier, analysts noted that Meta's stock exhibited short-term resilience despite mixed technical momentum and ongoing operational headwinds. With recent price action still holding above near-term support amid persistent volatility, investors should monitor for a confirmed break of resistance or renewed selling below key levels as potential signals for the next directional move.


-
 Afghanistan
-
 Albania
-
 Algeria
-
 Angola
-
 Argentina
-
 Armenia
-
 Australia
-
 Austria
-
 Azerbaijan
-
 Bahamas
-
 Bahrain
-
 Bangladesh
-
 Belarus
-
 Belgium
-
 Bolivia
-
 Botswana
-
 Brazil
-
 Brunei
-
 Bulgaria
-
 Cambodia
-
 Cameroon
-
 Canada
-
 Chile
Chile
-
 China
China
-
 Colombia
-
 Congo
Congo
-
 Costa Rica
-
 Cote d'Ivoire
-
 Croatia
-
 Cuba
Cuba
-
 Cyprus
-
 Czechia
-
 DR Congo
-
 Denmark
-
 Dominican Republic
-
 Ecuador
-
 Egypt
Egypt
-
 El Salvador
-
 Estonia
-
 Eswatini
-
 Ethiopia
-
 Finland
-
 France
-
 Georgia
-
 Germany
-
 Ghana
Ghana
-
 Greece
-
 Haiti
Haiti
-
 Hong Kong
-
 Hungary
-
 India
India
-
 Indonesia
-
 Iran, Islamic republic
-
 Iraq
Iraq
-
 Ireland
-
 Israel
-
 Italy
Italy
-
 Jamaica
-
 Japan
Japan
-
 Jordan
-
 Kazakhstan
-
 Kenya
Kenya
-
 Korea
Korea
-
 Kuwait
-
 Kyrgyzstan
-
 Laos
Laos
-
 Latvia
-
 Lebanon
-
 Lesotho
-
 Libya
Libya
-
 Lithuania
-
 Luxembourg
-
 Madagascar
-
 Malaysia
-
 Malta
Malta
-
 Mauritius
-
 Mexico
-
 Moldova
-
 Mongolia
-
 Montenegro
-
 Morocco
-
 Mozambique
-
 Myanmar
-
 Namibia
-
 Nepal
Nepal
-
 Netherlands
-
 New Zealand
-
 Nigeria
-
 North Macedonia
-
 Norway
-
 Oman
Oman
-
 Pakistan
-
 Palestine
-
 Panama
-
 Papua New Guinea
-
 Paraguay
-
 Peru
Peru
-
 Philippines
-
 Poland
-
 Portugal
-
 Puerto Rico
-
 Qatar
Qatar
-
 Reunion
-
 Romania
-
 Rwanda
-
 Saudi Arabia
-
 Serbia
-
 Singapore
-
 Slovakia
-
 Slovenia
-
 Somalia
-
 South Africa
-
 Spain
Spain
-
 Sri Lanka
-
 Sweden
-
 Switzerland
-
 Syria
Syria
-
 Taiwan
-
 Tajikistan
-
 Tanzania
-
 Thailand
-
 Trinidad and Tobago
-
 Tunisia
-
 Turkey
-
 UAE
UAE
-
 Uganda
-
 Ukraine
-
 United Kingdom
-
United States
-
 Uruguay
-
 Uzbekistan
-
 Venezuela
-
 Vietnam
-
 Yemen
Yemen
-
 Zambia
-
 Zimbabwe
- Forex
- Crypto
