
High volatility without clear trend drives QUBT stock downward

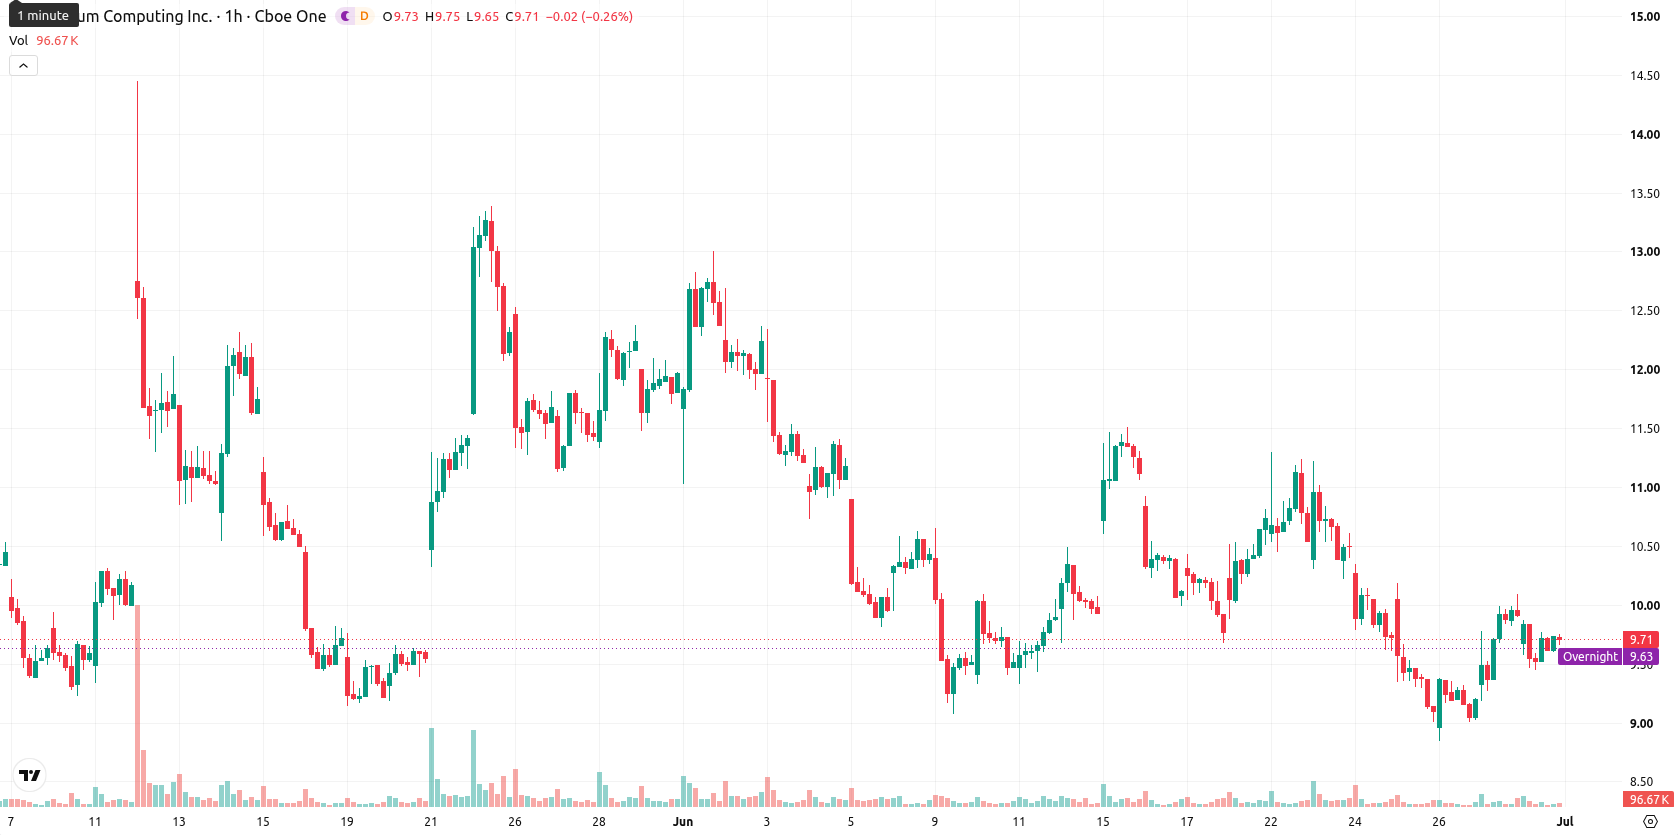
Quantum Computing (QUBT) stock is trading at $9.7 after a 2.22% move lower on the day, leaving it currently above its short-term averages while remaining under key medium- and long-term trendlines.
Highlights
- Quantum Computing shareholders approved an increase in authorized share capital, enabling greater flexibility for future equity issuances and capital restructuring.
- The company completed a $73 million acquisition of NHanced Semiconductor, extending reach in the semiconductor sector despite ongoing share price pressure.
- Technical signals indicate mixed momentum and high volatility, with price forecast to trade between $9.05 and $10.35, and a slight bias toward downside risk.
Capital structure flexibility as governance shifts and acquisition expand reach
Quantum Computing Inc. shareholders approved amendments to the company’s certificate of incorporation at the June 24, 2026 annual meeting, including an increase in authorized share capital, according to Tipranks. This governance move gives the company greater flexibility to issue additional equity, which could alter its capital structure and support future fundraising efforts. Separately, Quantum Computing completed its $73 million acquisition of NHanced Semiconductor, a transaction that broadens operational reach in the semiconductor industry and could influence enterprise value, though price action has remained under broader selling pressure.
Mixed momentum and high volatility as prices test technical barriers
QUBT has established the $9.55 level as a short-term pivot, with recent closes holding above the 20-day moving average but remaining capped below the 50-day ($9.91) and 200-day ($11.61) moving averages. The Ichimoku Kijun serves as immediate support at $9.47, while resistance is seen at $9.91 and $10.35. On the indicator side, the Relative Strength Index (RSI) prints at 50.86, pointing to mild buy bias, while Stochastic RSI signals a sell and Commodity Channel Index (CCI) is neutral. Both Moving Average Convergence Divergence (MACD) and Average Directional Index (ADX) are neutral. Bull/Bear Power highlights strong buying pressure, and the Awesome Oscillator supports near-term bullish momentum. This collection of mixed signals and high volatility underlines significant uncertainty and lack of a clear directional trend.
Downside risks intensify as volatility brackets near-term breakout
Over the next several sessions, QUBT is expected to fluctuate within a volatility band between $9.05 and $10.35. Probabilities marginally favor a downward break, with a 56% chance of testing or breaching the lower band. Should QUBT hold above $10.35 on a sustained basis, a bullish upside scenario would be confirmed and momentum could accelerate. On the downside, a move below $9.47 would act as a trigger for renewed selling pressure, exposing further declines.
Earlier, analysts noted that persistent selling pressure and conflicted technical signals kept Quantum Computing Inc. in a broadly bearish setup despite recent corporate developments. The latest governance changes and acquisition add new strategic catalysts, but with volatility elevated and directional bias lacking, traders should closely monitor price stability above $9.47 for early signs of either a renewed breakdown or the emergence of sustained upside momentum.


Latest Quantum Computing News


-
 Afghanistan
-
 Albania
-
 Algeria
-
 Angola
-
 Argentina
-
 Armenia
-
 Australia
-
 Austria
-
 Azerbaijan
-
 Bahamas
-
 Bahrain
-
 Bangladesh
-
 Belarus
-
 Belgium
-
 Bolivia
-
 Botswana
-
 Brazil
-
 Brunei
-
 Bulgaria
-
 Cambodia
-
 Cameroon
-
 Canada
-
 Chile
Chile
-
 China
China
-
 Colombia
-
 Congo
Congo
-
 Costa Rica
-
 Cote d'Ivoire
-
 Croatia
-
 Cuba
Cuba
-
 Cyprus
-
 Czechia
-
 DR Congo
-
 Denmark
-
 Dominican Republic
-
 Ecuador
-
 Egypt
Egypt
-
 El Salvador
-
 Estonia
-
 Eswatini
-
 Ethiopia
-
 Finland
-
 France
-
 Georgia
-
 Germany
-
 Ghana
Ghana
-
 Greece
-
 Haiti
Haiti
-
 Hong Kong
-
 Hungary
-
 India
India
-
 Indonesia
-
 Iran, Islamic republic
-
 Iraq
Iraq
-
 Ireland
-
 Israel
-
 Italy
Italy
-
 Jamaica
-
 Japan
Japan
-
 Jordan
-
 Kazakhstan
-
 Kenya
Kenya
-
 Korea
Korea
-
 Kuwait
-
 Kyrgyzstan
-
 Laos
Laos
-
 Latvia
-
 Lebanon
-
 Lesotho
-
 Libya
Libya
-
 Lithuania
-
 Luxembourg
-
 Madagascar
-
 Malaysia
-
 Malta
Malta
-
 Mauritius
-
 Mexico
-
 Moldova
-
 Mongolia
-
 Montenegro
-
 Morocco
-
 Mozambique
-
 Myanmar
-
 Namibia
-
 Nepal
Nepal
-
 Netherlands
-
 New Zealand
-
 Nigeria
-
 North Macedonia
-
 Norway
-
 Oman
Oman
-
 Pakistan
-
 Palestine
-
 Panama
-
 Papua New Guinea
-
 Paraguay
-
 Peru
Peru
-
 Philippines
-
 Poland
-
 Portugal
-
 Puerto Rico
-
 Qatar
Qatar
-
 Reunion
-
 Romania
-
 Rwanda
-
 Saudi Arabia
-
 Serbia
-
 Singapore
-
 Slovakia
-
 Slovenia
-
 Somalia
-
 South Africa
-
 Spain
Spain
-
 Sri Lanka
-
 Sweden
-
 Switzerland
-
 Syria
Syria
-
 Taiwan
-
 Tajikistan
-
 Tanzania
-
 Thailand
-
 Trinidad and Tobago
-
 Tunisia
-
 Turkey
-
 UAE
UAE
-
 Uganda
-
 Ukraine
-
 United Kingdom
-
United States
-
 Uruguay
-
 Uzbekistan
-
 Venezuela
-
 Vietnam
-
 Yemen
Yemen
-
 Zambia
-
 Zimbabwe
- Forex
- Crypto
