
Intel stock price forecast: $113.13–$134.47 range as INTC drops 2.52%

Intel (INTC) stock is trading at $123.8, down 2.52% for the session. The price sits below its key short- and medium-term moving averages, while remaining above the long-term average.
Highlights
- Investors are taking profits ahead of Intel's July 23 earnings as they await updates on foundry contract progress, particularly the anticipated Apple deal.
- Sentiment has turned more cautious after Intel's market capitalization surged by around $480 billion in the second quarter, with no immediate new disclosures.
- Technical indicators signal strong intraday bearish momentum, with a prevailing 78% probability of price moving lower in the $113.13–$134.47 range.
Profit-taking and muted sentiment as earnings anticipation builds
Ahead of Intel's scheduled second-quarter earnings report on July 23, investors have engaged in profit-taking as they await the company's formal updates on foundry contract progress, including details of the anticipated Apple deal, according to Benzinga, Moneycheck, and Tradingkey. This shift in market posture reflects a pause among shareholders following a sharp rise in Intel's market capitalization by approximately $480 billion during the second quarter. The combination of sizable recent gains and the lack of immediate new disclosures has contributed to a more cautious near-term sentiment going into the upcoming earnings event.
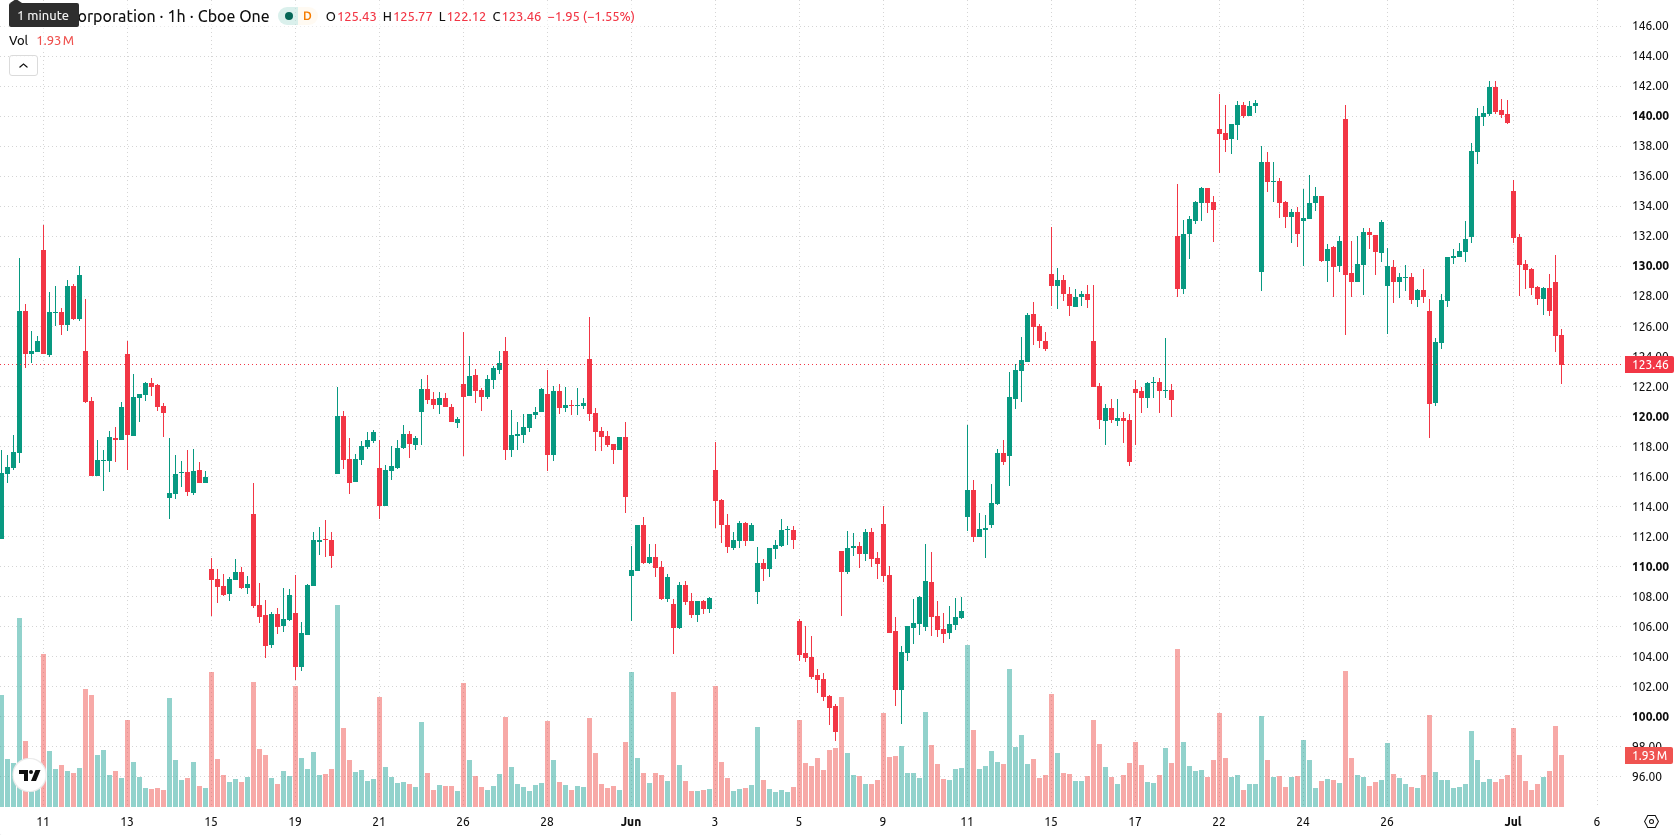
Bearish signals intensify as intraday sellers dominate and resistance holds
INTC trades below its 20-period ($132.89) and 50-period ($131.39) moving averages on the hourly chart, while maintaining a position above the 200-period moving average ($59.84). Immediate resistance is set at the Ichimoku Kijun level of $130.42, with price structure suggesting short- and medium-term overhead pressure. The Relative Strength Index (RSI) stands at 33.91, signaling a sell, complemented by bearish readings on both the Moving Average Convergence Divergence (MACD) and Average Directional Index (ADX). Additional indicators, including Stochastic RSI, Commodity Channel Index (CCI), and Bull/Bear Power, are in oversold territory, reinforcing intraday seller dominance. The Awesome Oscillator also aligns with this prevailing bearish momentum, and no significant bullish divergence is present across these indicators.
Directional tilt favors downside amid range-bound volatility
In the short term, INTC is projected to trade within the $113.13 to $134.47 range, reflecting typical volatility relative to current levels. The likelihood of a downward move is elevated, with a 78% probability, while the probability of an upside move remains limited at 22%. The baseline scenario suggests price will remain range-bound between recent highs and lows. In a bullish scenario, any upside would require a break above resistance at the Ichimoku Kijun. If the current trajectory persists, the bearish scenario would see price extend losses through the projected support levels.
Earlier, analysts noted that Intel displayed persistent bullish momentum but cautioned investors to monitor for shifts in trend and volume dynamics. The current technical setup indicates growing downside risk ahead of the upcoming earnings report, making it crucial for traders to watch for a decisive move through support or resistance levels as the next directional catalyst.


-
 Afghanistan
-
 Albania
-
 Algeria
-
 Angola
-
 Argentina
-
 Armenia
-
 Australia
-
 Austria
-
 Azerbaijan
-
 Bahamas
-
 Bahrain
-
 Bangladesh
-
 Belarus
-
 Belgium
-
 Bolivia
-
 Botswana
-
 Brazil
-
 Brunei
-
 Bulgaria
-
 Cambodia
-
 Cameroon
-
 Canada
-
 Chile
Chile
-
 China
China
-
 Colombia
-
 Congo
Congo
-
 Costa Rica
-
 Cote d'Ivoire
-
 Croatia
-
 Cuba
Cuba
-
 Cyprus
-
 Czechia
-
 DR Congo
-
 Denmark
-
 Dominican Republic
-
 Ecuador
-
 Egypt
Egypt
-
 El Salvador
-
 Estonia
-
 Eswatini
-
 Ethiopia
-
 Finland
-
 France
-
 Georgia
-
 Germany
-
 Ghana
Ghana
-
 Greece
-
 Haiti
Haiti
-
 Hong Kong
-
 Hungary
-
 India
India
-
 Indonesia
-
 Iran, Islamic republic
-
 Iraq
Iraq
-
 Ireland
-
 Israel
-
 Italy
Italy
-
 Jamaica
-
 Japan
Japan
-
 Jordan
-
 Kazakhstan
-
 Kenya
Kenya
-
 Korea
Korea
-
 Kuwait
-
 Kyrgyzstan
-
 Laos
Laos
-
 Latvia
-
 Lebanon
-
 Lesotho
-
 Libya
Libya
-
 Lithuania
-
 Luxembourg
-
 Madagascar
-
 Malaysia
-
 Malta
Malta
-
 Mauritius
-
 Mexico
-
 Moldova
-
 Mongolia
-
 Montenegro
-
 Morocco
-
 Mozambique
-
 Myanmar
-
 Namibia
-
 Nepal
Nepal
-
 Netherlands
-
 New Zealand
-
 Nigeria
-
 North Macedonia
-
 Norway
-
 Oman
Oman
-
 Pakistan
-
 Palestine
-
 Panama
-
 Papua New Guinea
-
 Paraguay
-
 Peru
Peru
-
 Philippines
-
 Poland
-
 Portugal
-
 Puerto Rico
-
 Qatar
Qatar
-
 Reunion
-
 Romania
-
 Rwanda
-
 Saudi Arabia
-
 Serbia
-
 Singapore
-
 Slovakia
-
 Slovenia
-
 Somalia
-
 South Africa
-
 Spain
Spain
-
 Sri Lanka
-
 Sweden
-
 Switzerland
-
 Syria
Syria
-
 Taiwan
-
 Tajikistan
-
 Tanzania
-
 Thailand
-
 Trinidad and Tobago
-
 Tunisia
-
 Turkey
-
 UAE
UAE
-
 Uganda
-
 Ukraine
-
 United Kingdom
-
United States
-
 Uruguay
-
 Uzbekistan
-
 Venezuela
-
 Vietnam
-
 Yemen
Yemen
-
 Zambia
-
 Zimbabwe
- Forex
- Crypto
