
AAPL stock edges lower amid strong RSI and overbought signals: weekly analysis

Apple Inc. (AAPL) is trading at $307.94, well above its weekly MA-20 ($280.94), MA-50 ($265.84), and MA-200 ($209.24) levels. Over the past week, AAPL slipped $0.17 (0.06%), consolidating near the upper part of its range and maintaining a strong bullish bias above all key moving averages.
 314.79
315.48
314.79
315.48
Highlights
- AAPL maintains a strong bullish trend, trading well above key moving averages on the weekly chart.
- Short-term oscillators indicate overbought conditions and buyer exhaustion, causing recent price consolidation near the upper range.
- AAPL is likely to trade between $293.00 and $313.00 over the next week, with a 75% probability of further upside unless momentum wanes below $293.00.
Record quarter and expanded buybacks as demand and regulatory issues shape flows
Apple announced a new $100 billion share buyback authorization, further extending its capital return program. The company reported record March quarter revenue of $111.2 billion, supported by strong iPhone 17 demand and an all-time high Services segment revenue of $31 billion. Apple also raised its quarterly dividend to $0.27 per share, with the next payment scheduled for May 14, 2026, and extended a multi-billion dollar chip supply partnership with Broadcom through 2031. On the regulatory front, Apple faced an adverse EU decision regarding 'gatekeeper' platform regulations.
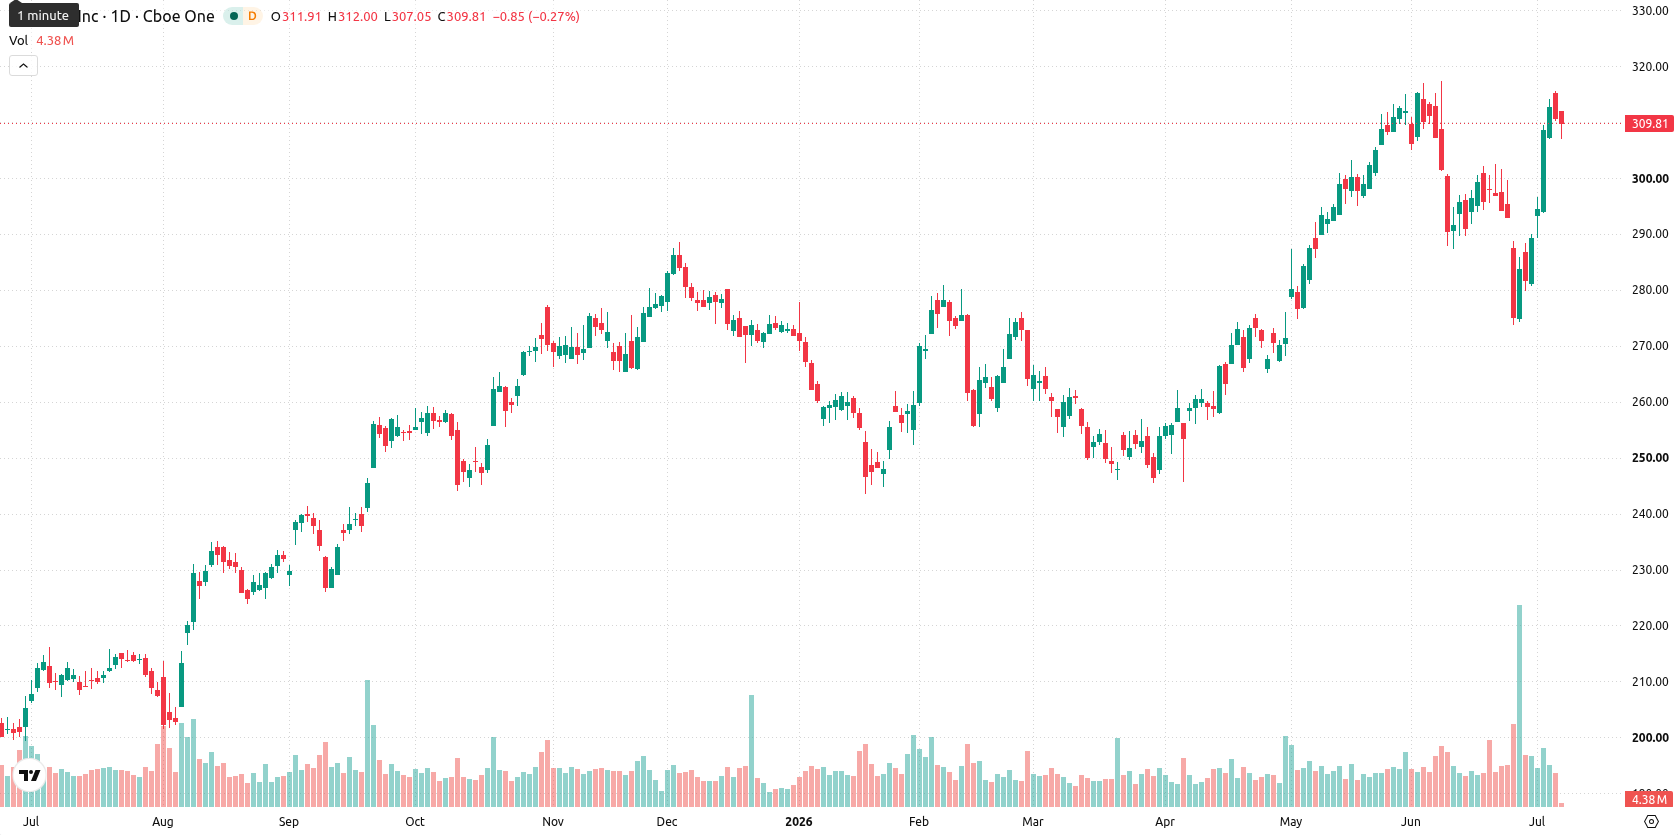
Positive momentum signals and overbought readings as buyer strength persists this week
On the weekly chart, momentum remains positive as the MACD and ADX both signal a buy. The RSI is trending higher and sits in bullish territory, although the Commodity Channel Index and Bull/Bear Power indicate overbought conditions, suggesting buyer dominance is strong but there may be short-term exhaustion. Stochastic RSI shows a neutral reading, reflecting a pause in upside momentum, while the Awesome Oscillator does not currently confirm the trend. Weekly support is seen at $293.00, with resistance at $313.00, and weekly volatility is 6.14%.
Consolidation expected with upside breakout risk as strong signals continue next week
Over the next 5 trading days, AAPL is expected to trade within a $293.00 to $313.00 range, based on typical weekly volatility. With three out of four major indicators (RSI, ADX, MACD) on a buy or strong buy signal and only the CCI showing overbought conditions, the baseline scenario is for continued consolidation near the highs. A bullish breakout above $313.00 could extend gains toward new highs, while a move below $293.00 would indicate momentum fading and possible further profit-taking toward moving average support.
Previously it was reported that Apple’s long-term outlook remained constructive, supported by increased chip supply stability and ongoing ecosystem growth, despite regulatory challenges in Europe. With fresh record revenues, an expanded buyback program, and bullish weekly technical signals, Apple’s prevailing scenario is consolidation near highs, making a decisive breakout above $313.00 a key level for traders to monitor in the coming days.















-
 Afghanistan
-
 Albania
-
 Algeria
-
 Angola
-
 Argentina
-
 Armenia
-
 Australia
-
 Austria
-
 Azerbaijan
-
 Bahamas
-
 Bahrain
-
 Bangladesh
-
 Belarus
-
 Belgium
-
 Bolivia
-
 Botswana
-
 Brazil
-
 Brunei
-
 Bulgaria
-
 Cambodia
-
 Cameroon
-
 Canada
-
 Chile
Chile
-
 China
China
-
 Colombia
-
 Congo
Congo
-
 Costa Rica
-
 Cote d'Ivoire
-
 Croatia
-
 Cuba
Cuba
-
 Cyprus
-
 Czechia
-
 DR Congo
-
 Denmark
-
 Dominican Republic
-
 Ecuador
-
 Egypt
Egypt
-
 El Salvador
-
 Estonia
-
 Eswatini
-
 Ethiopia
-
 Finland
-
 France
-
 Georgia
-
 Germany
-
 Ghana
Ghana
-
 Greece
-
 Haiti
Haiti
-
 Hong Kong
-
 Hungary
-
 India
India
-
 Indonesia
-
 Iran, Islamic republic
-
 Iraq
Iraq
-
 Ireland
-
 Israel
-
 Italy
Italy
-
 Jamaica
-
 Japan
Japan
-
 Jordan
-
 Kazakhstan
-
 Kenya
Kenya
-
 Korea
Korea
-
 Kuwait
-
 Kyrgyzstan
-
 Laos
Laos
-
 Latvia
-
 Lebanon
-
 Lesotho
-
 Libya
Libya
-
 Lithuania
-
 Luxembourg
-
 Madagascar
-
 Malaysia
-
 Malta
Malta
-
 Mauritius
-
 Mexico
-
 Moldova
-
 Mongolia
-
 Montenegro
-
 Morocco
-
 Mozambique
-
 Myanmar
-
 Namibia
-
 Nepal
Nepal
-
 Netherlands
-
 New Zealand
-
 Nigeria
-
 North Macedonia
-
 Norway
-
 Oman
Oman
-
 Pakistan
-
 Palestine
-
 Panama
-
 Papua New Guinea
-
 Paraguay
-
 Peru
Peru
-
 Philippines
-
 Poland
-
 Portugal
-
 Puerto Rico
-
 Qatar
Qatar
-
 Reunion
-
 Romania
-
 Rwanda
-
 Saudi Arabia
-
 Serbia
-
 Singapore
-
 Slovakia
-
 Slovenia
-
 Somalia
-
 South Africa
-
 Spain
Spain
-
 Sri Lanka
-
 Sweden
-
 Switzerland
-
 Syria
Syria
-
 Taiwan
-
 Tajikistan
-
 Tanzania
-
 Thailand
-
 Trinidad and Tobago
-
 Tunisia
-
 Turkey
-
 UAE
UAE
-
 Uganda
-
 Ukraine
-
 United Kingdom
-
United States
-
 Uruguay
-
 Uzbekistan
-
 Venezuela
-
 Vietnam
-
 Yemen
Yemen
-
 Zambia
-
 Zimbabwe
- Forex
- Crypto











