
Meta stock gains amid high current volatility between $560 and $630: weekly forecast

Meta Platforms, Inc. (META, formerly Facebook) closed the week at $604.10, marking a gain of $22.10 (3.85%) over the last seven days. META trades just below the weekly MA-20 at $607.34 and well under the MA-50 at $657.32, reflecting ongoing medium-term selling pressure, but remains comfortably above the MA-200 at $471.01, which continues to act as strong long-term support.
 607.31
625.37
607.31
625.37
Highlights
- Meta trades below short- and medium-term moving averages, indicating persistent seller pressure but holds above major long-term support.
- Momentum signals are mixed with weak trend strength, suggesting an indecisive and cautious market outlook for Meta.
- Meta's price is forecast to move sideways between $560 and $630 over the next week, with downside risk favored over a breakout.
AI expansion and rising regulatory risks drive sentiment shifts this week
Meta announced the launch of Muse Image, a new advanced AI model for Instagram and WhatsApp, and introduced Meta Compute to monetize excess data center capacity for third-party developers. The company is expanding its artificial intelligence footprint through a reported $6.5 billion collaboration with Samsung for next-generation MTIA AI chips and is looking at opportunities in cloud computing by renting out spare AI capacity. Regulatory challenges intensified as four US states are jointly seeking around $1.4 trillion in penalties tied to youth safety, and Meta is currently defending over 2,400 federal lawsuits on this issue.
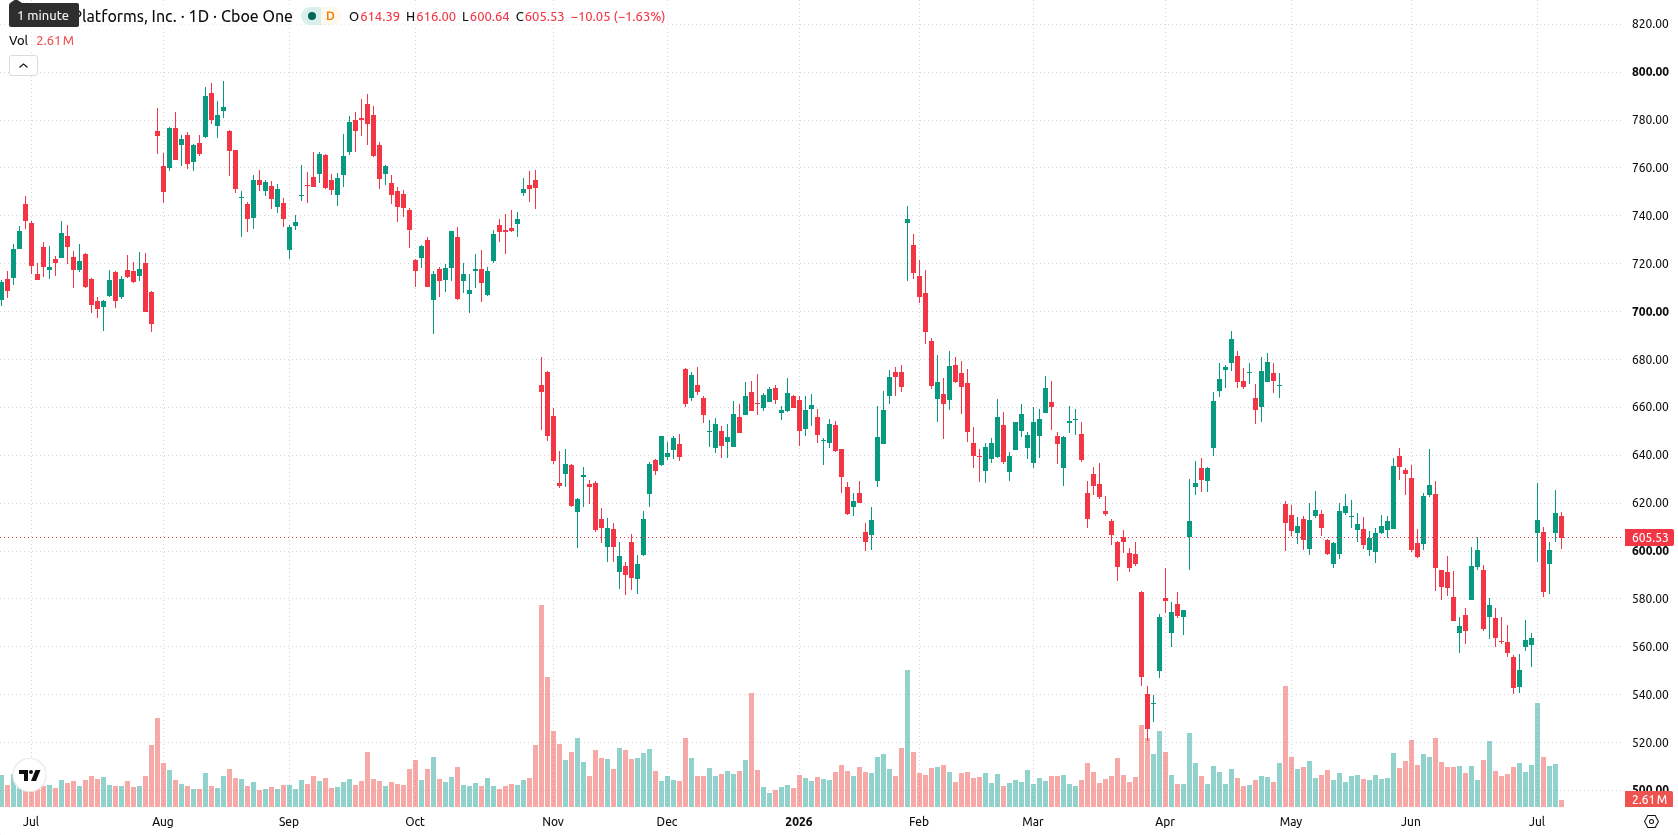
Mixed weekly momentum keeps Meta in mid-range as volatility surges
On the weekly chart, Meta stabilizes between the MA-20 ($607.34) and MA-50 ($657.32), with long-term support at the MA-200 ($471.01). Price action sits in the middle of the recent W1 range and volatility was notably high at 7.68%. Weekly momentum signals are mixed: the MACD shows a mild bearish trend, ADX remains weak, RSI and CCI are neutral to slightly bearish, and the Stochastic RSI signals bullish conditions near overbought territory. Oscillator divergence and the bearish tone on the Awesome Oscillator add to market indecision, while Bull/Bear Power still gives buyers a slight advantage.
Sideways trading with bearish tilt projected for the coming week
For the next five trading days, META is expected to fluctuate between $560 and $630, based on weekly volatility and the current technical setup. The weekly scenario points toward sideways movement, with a declining bias as most signals are neutral or bearish and no key indicators support a strong buy. A bullish scenario would require an upside breakout above $630, while a sustained drop below $560 could potentially accelerate further declines. Overall, the base case remains cautious with choppy price action prevailing.
Previously it was reported that Meta was pursuing growth through AI expansion cost optimization and new monetization strategies while navigating mixed technical signals. The current backdrop adds heightened regulatory risk and further volatility, making it essential for traders to watch for a confirmed breakout above $630 or a breakdown below $560 as signals for a new directional move.















-
 Afghanistan
-
 Albania
-
 Algeria
-
 Angola
-
 Argentina
-
 Armenia
-
 Australia
-
 Austria
-
 Azerbaijan
-
 Bahamas
-
 Bahrain
-
 Bangladesh
-
 Belarus
-
 Belgium
-
 Bolivia
-
 Botswana
-
 Brazil
-
 Brunei
-
 Bulgaria
-
 Cambodia
-
 Cameroon
-
 Canada
-
 Chile
Chile
-
 China
China
-
 Colombia
-
 Congo
Congo
-
 Costa Rica
-
 Cote d'Ivoire
-
 Croatia
-
 Cuba
Cuba
-
 Cyprus
-
 Czechia
-
 DR Congo
-
 Denmark
-
 Dominican Republic
-
 Ecuador
-
 Egypt
Egypt
-
 El Salvador
-
 Estonia
-
 Eswatini
-
 Ethiopia
-
 Finland
-
 France
-
 Georgia
-
 Germany
-
 Ghana
Ghana
-
 Greece
-
 Haiti
Haiti
-
 Hong Kong
-
 Hungary
-
 India
India
-
 Indonesia
-
 Iran, Islamic republic
-
 Iraq
Iraq
-
 Ireland
-
 Israel
-
 Italy
Italy
-
 Jamaica
-
 Japan
Japan
-
 Jordan
-
 Kazakhstan
-
 Kenya
Kenya
-
 Korea
Korea
-
 Kuwait
-
 Kyrgyzstan
-
 Laos
Laos
-
 Latvia
-
 Lebanon
-
 Lesotho
-
 Libya
Libya
-
 Lithuania
-
 Luxembourg
-
 Madagascar
-
 Malaysia
-
 Malta
Malta
-
 Mauritius
-
 Mexico
-
 Moldova
-
 Mongolia
-
 Montenegro
-
 Morocco
-
 Mozambique
-
 Myanmar
-
 Namibia
-
 Nepal
Nepal
-
 Netherlands
-
 New Zealand
-
 Nigeria
-
 North Macedonia
-
 Norway
-
 Oman
Oman
-
 Pakistan
-
 Palestine
-
 Panama
-
 Papua New Guinea
-
 Paraguay
-
 Peru
Peru
-
 Philippines
-
 Poland
-
 Portugal
-
 Puerto Rico
-
 Qatar
Qatar
-
 Reunion
-
 Romania
-
 Rwanda
-
 Saudi Arabia
-
 Serbia
-
 Singapore
-
 Slovakia
-
 Slovenia
-
 Somalia
-
 South Africa
-
 Spain
Spain
-
 Sri Lanka
-
 Sweden
-
 Switzerland
-
 Syria
Syria
-
 Taiwan
-
 Tajikistan
-
 Tanzania
-
 Thailand
-
 Trinidad and Tobago
-
 Tunisia
-
 Turkey
-
 UAE
UAE
-
 Uganda
-
 Ukraine
-
 United Kingdom
-
United States
-
 Uruguay
-
 Uzbekistan
-
 Venezuela
-
 Vietnam
-
 Yemen
Yemen
-
 Zambia
-
 Zimbabwe
- Forex
- Crypto











