
Microsoft shares face resistance at $388 amid negative MACD and declining RSI: weekly report

Microsoft Corporation (MSFT) closed the week at $382.81, falling $7.07 or 1.81% over the past seven days and ending right at the bottom of its weekly price range. The stock is currently trading below its weekly MA-20 ($398.65), MA-50 ($451.67), and just under its MA-200 ($388.35), reinforcing the bearish pressure across all major timeframes.
 384.54
395.57
384.54
395.57
Highlights
- Microsoft trades below key moving averages as sustained selling pressure signals a prevailing bearish trend.
- Weekly momentum indicators confirm negative sentiment, with no signs of imminent oversold conditions or buying momentum.
- MSFT is expected to oscillate between $368 and $396 next week, with a stronger likelihood of further downside if selling persists.
Earnings focus and quantum deals shape sentiment despite legal, AI headwinds
Microsoft will publish its fiscal year 2026 fourth-quarter results after the market closes on July 29, 2026, which remains a key focus for the company. The firm continues to advance its quantum computing initiatives, further developing its Quantum Safe Program and expanding quantum communications through the acquisition of NuCrypt. Ongoing securities class action lawsuits related to Copilot issues and increased institutional holdings add to the corporate backdrop, alongside its continued investment in AI and cloud strategies.
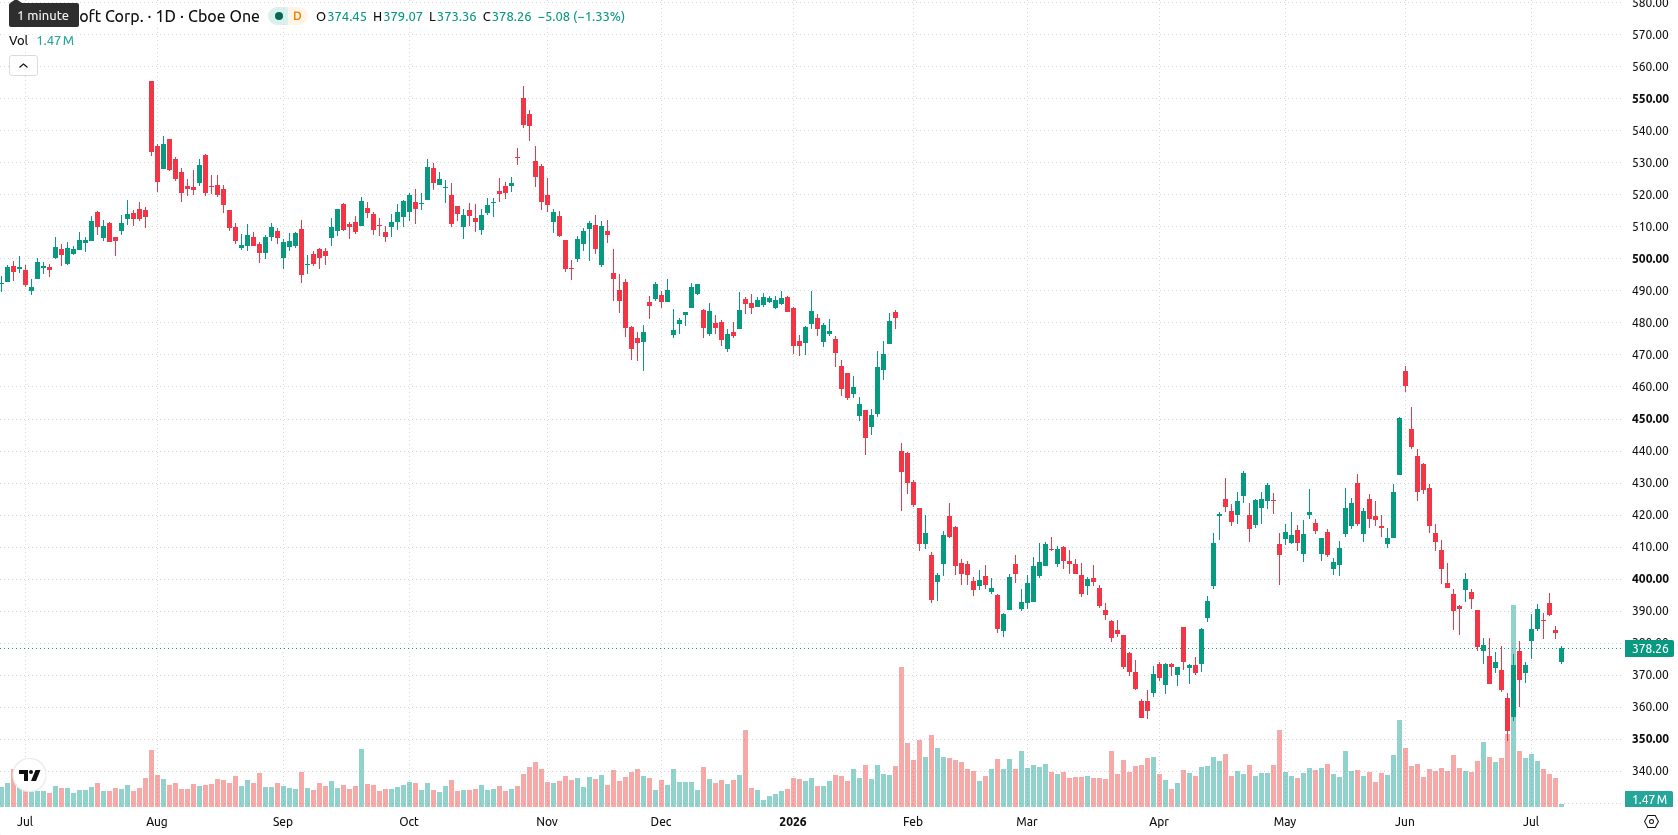
Downside risk persists as bearish momentum aligns with resistance levels
Momentum on the weekly chart remains bearish, with the MACD, ADX, and Awesome Oscillator all pointing to continued downside risks. Both RSI and Stochastic RSI are moving lower but not yet into oversold territory, while the CCI remains neutral. Volatility on the week reached 3.76%, and both the MA-20 ($398.65) and MA-200 ($388.35) serve as near-term resistance, with support found around $368 based on recent price behavior. Bull/Bear Power data continues to reflect strong seller dominance.
Further weakness favored as upside scenarios lack technical support
For the coming five trading days, MSFT is expected to fluctuate between $368 and $396, consistent with its recent weekly volatility and the current technical configuration. The probability of a sustained rebound remains low (below 20%) due to a lack of bullish confirmation on major indicators. The more likely scenario sees the price consolidating, with a bias toward further weakness and a possible drop below $368 if selling persists. A decisive move above $396 would require a clear change in momentum, which is not currently supported by technical signals.
Earlier, analysts noted that Microsoft's long-term growth prospects remain anchored in its AI and cloud strategy, despite near-term technical weakness and sector-specific headwinds. The latest technical and volatility data reinforce this outlook, highlighting a continued bias toward downside risk with $368 as a pivotal support level for traders to monitor in the coming week.



Latest Microsoft News







-
 Afghanistan
-
 Albania
-
 Algeria
-
 Angola
-
 Argentina
-
 Armenia
-
 Australia
-
 Austria
-
 Azerbaijan
-
 Bahamas
-
 Bahrain
-
 Bangladesh
-
 Belarus
-
 Belgium
-
 Bolivia
-
 Botswana
-
 Brazil
-
 Brunei
-
 Bulgaria
-
 Cambodia
-
 Cameroon
-
 Canada
-
 Chile
Chile
-
 China
China
-
 Colombia
-
 Congo
Congo
-
 Costa Rica
-
 Cote d'Ivoire
-
 Croatia
-
 Cuba
Cuba
-
 Cyprus
-
 Czechia
-
 DR Congo
-
 Denmark
-
 Dominican Republic
-
 Ecuador
-
 Egypt
Egypt
-
 El Salvador
-
 Estonia
-
 Eswatini
-
 Ethiopia
-
 Finland
-
 France
-
 Georgia
-
 Germany
-
 Ghana
Ghana
-
 Greece
-
 Haiti
Haiti
-
 Hong Kong
-
 Hungary
-
 India
India
-
 Indonesia
-
 Iran, Islamic republic
-
 Iraq
Iraq
-
 Ireland
-
 Israel
-
 Italy
Italy
-
 Jamaica
-
 Japan
Japan
-
 Jordan
-
 Kazakhstan
-
 Kenya
Kenya
-
 Korea
Korea
-
 Kuwait
-
 Kyrgyzstan
-
 Laos
Laos
-
 Latvia
-
 Lebanon
-
 Lesotho
-
 Libya
Libya
-
 Lithuania
-
 Luxembourg
-
 Madagascar
-
 Malaysia
-
 Malta
Malta
-
 Mauritius
-
 Mexico
-
 Moldova
-
 Mongolia
-
 Montenegro
-
 Morocco
-
 Mozambique
-
 Myanmar
-
 Namibia
-
 Nepal
Nepal
-
 Netherlands
-
 New Zealand
-
 Nigeria
-
 North Macedonia
-
 Norway
-
 Oman
Oman
-
 Pakistan
-
 Palestine
-
 Panama
-
 Papua New Guinea
-
 Paraguay
-
 Peru
Peru
-
 Philippines
-
 Poland
-
 Portugal
-
 Puerto Rico
-
 Qatar
Qatar
-
 Reunion
-
 Romania
-
 Rwanda
-
 Saudi Arabia
-
 Serbia
-
 Singapore
-
 Slovakia
-
 Slovenia
-
 Somalia
-
 South Africa
-
 Spain
Spain
-
 Sri Lanka
-
 Sweden
-
 Switzerland
-
 Syria
Syria
-
 Taiwan
-
 Tajikistan
-
 Tanzania
-
 Thailand
-
 Trinidad and Tobago
-
 Tunisia
-
 Turkey
-
 UAE
UAE
-
 Uganda
-
 Ukraine
-
 United Kingdom
-
United States
-
 Uruguay
-
 Uzbekistan
-
 Venezuela
-
 Vietnam
-
 Yemen
Yemen
-
 Zambia
-
 Zimbabwe
- Forex
- Crypto











