

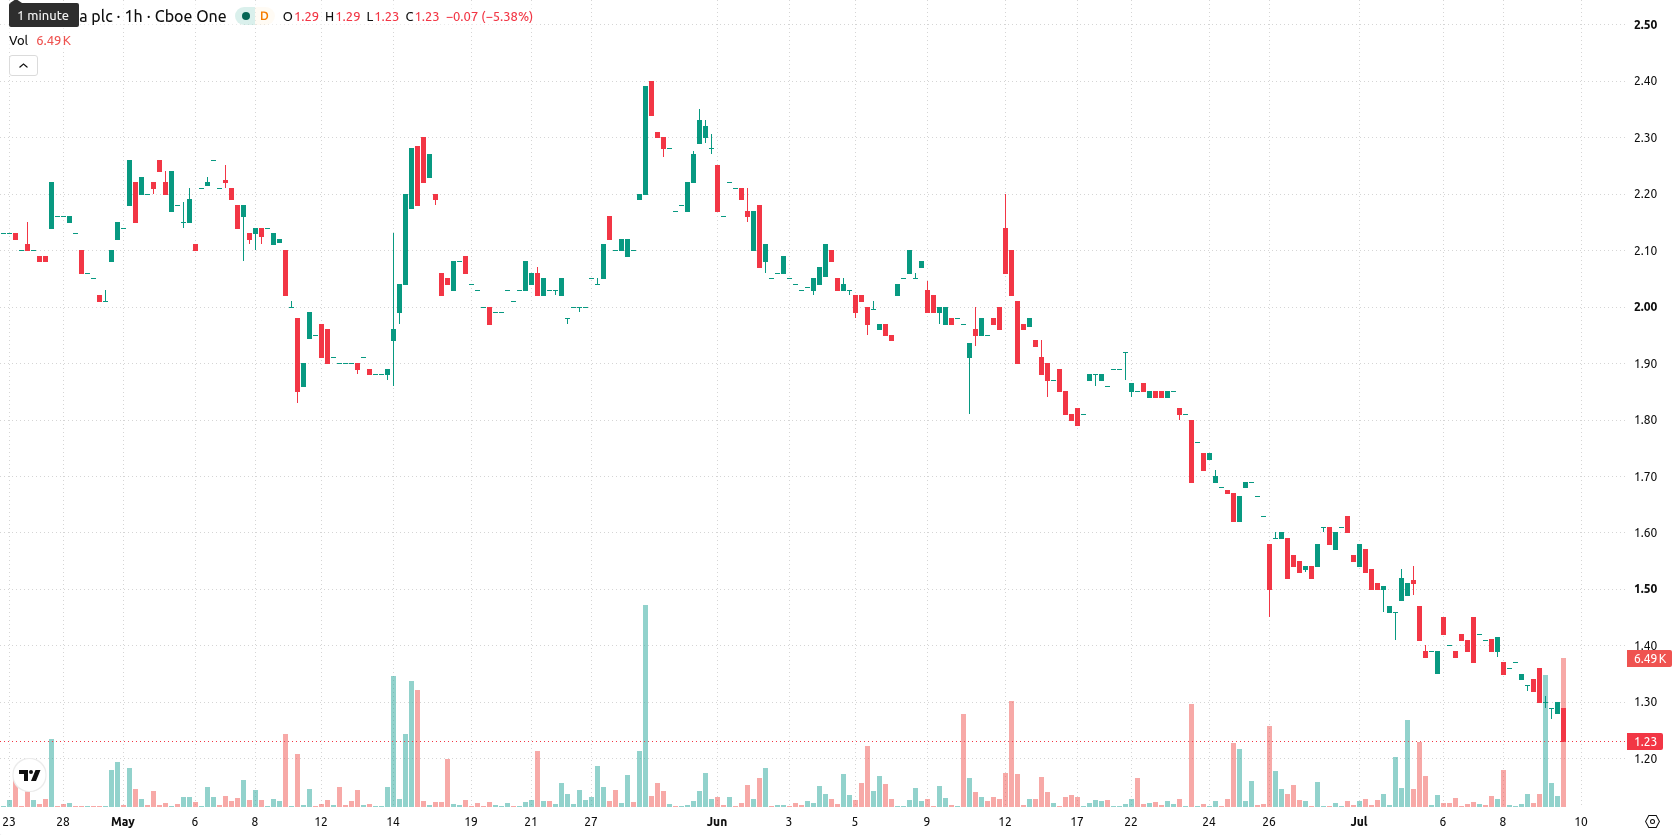
NuCana (NCNA) stock is trading at $1.27, down 4.17% on the day and closing near session lows. The price stands below its key moving averages, pointing to a continuation of bearish momentum.
 1.40
1.48
1.40
1.48
Highlights
- NCNA remains under persistent selling pressure, trading below all key moving averages and experiencing elevated volatility near intraday lows.
- Multiple momentum and oscillator indicators signal a firm bearish trend, although oversold conditions suggest some near-term downside exhaustion.
- Expected trading range is $1.20 to $1.36, with a much higher probability of further decline if $1.20 support fails.
Oversold signals deepen as sellers retain firm grip
Technically, NCNA is trading below its 20-day, 50-day, and 200-day moving averages, with the MA-20 at $1.36, MA-50 at $1.45, and MA-200 at $2.87. The Ichimoku Kijun sits at $1.36 and serves as immediate resistance. Momentum indicators are negative: the Moving Average Convergence Divergence (MACD) signals a sell, Average Directional Index (ADX) is neutral, and the Relative Strength Index (RSI) reads 32.93. Stochastic RSI and Commodity Channel Index (CCI) are both in oversold territory, indicating downside exhaustion, while Bull/Bear Power and the Awesome Oscillator confirm that sellers maintain control. There are no major divergences between oscillators and momentum, reinforcing an intraday bearish tone.
Low breakout odds as downside risk overshadows sideways trade
In the short term, NCNA is expected to trade within a range of $1.20 to $1.36, which represents a typical volatility band relative to current levels. The probability of an upward breakout is very low, while the potential for further downside remains high. Should NCNA remain within this projected corridor, prices are likely to move sideways. If price moves above immediate resistance at $1.36, this would set up a bullish scenario, whereas a drop below $1.20 could accelerate further declines.
Earlier, analysts noted that NuCana shares faced persistent downside risks amid dominant selling pressure and mixed technical signals. The current analysis reinforces this cautious stance, highlighting that sustained weakness keeps the focus on the $1.20 level as a pivotal threshold for further downside risk.









-
 Afghanistan
-
 Albania
-
 Algeria
-
 Angola
-
 Argentina
-
 Armenia
-
 Australia
-
 Austria
-
 Azerbaijan
-
 Bahamas
-
 Bahrain
-
 Bangladesh
-
 Belarus
-
 Belgium
-
 Bolivia
-
 Botswana
-
 Brazil
-
 Brunei
-
 Bulgaria
-
 Cambodia
-
 Cameroon
-
 Canada
-
 Chile
Chile
-
 China
China
-
 Colombia
-
 Congo
Congo
-
 Costa Rica
-
 Cote d'Ivoire
-
 Croatia
-
 Cuba
Cuba
-
 Cyprus
-
 Czechia
-
 DR Congo
-
 Denmark
-
 Dominican Republic
-
 Ecuador
-
 Egypt
Egypt
-
 El Salvador
-
 Estonia
-
 Eswatini
-
 Ethiopia
-
 Finland
-
 France
-
 Georgia
-
 Germany
-
 Ghana
Ghana
-
 Greece
-
 Haiti
Haiti
-
 Hong Kong
-
 Hungary
-
 India
India
-
 Indonesia
-
 Iran, Islamic republic
-
 Iraq
Iraq
-
 Ireland
-
 Israel
-
 Italy
Italy
-
 Jamaica
-
 Japan
Japan
-
 Jordan
-
 Kazakhstan
-
 Kenya
Kenya
-
 Korea
Korea
-
 Kuwait
-
 Kyrgyzstan
-
 Laos
Laos
-
 Latvia
-
 Lebanon
-
 Lesotho
-
 Libya
Libya
-
 Lithuania
-
 Luxembourg
-
 Madagascar
-
 Malaysia
-
 Malta
Malta
-
 Mauritius
-
 Mexico
-
 Moldova
-
 Mongolia
-
 Montenegro
-
 Morocco
-
 Mozambique
-
 Myanmar
-
 Namibia
-
 Nepal
Nepal
-
 Netherlands
-
 New Zealand
-
 Nigeria
-
 North Macedonia
-
 Norway
-
 Oman
Oman
-
 Pakistan
-
 Palestine
-
 Panama
-
 Papua New Guinea
-
 Paraguay
-
 Peru
Peru
-
 Philippines
-
 Poland
-
 Portugal
-
 Puerto Rico
-
 Qatar
Qatar
-
 Reunion
-
 Romania
-
 Rwanda
-
 Saudi Arabia
-
 Serbia
-
 Singapore
-
 Slovakia
-
 Slovenia
-
 Somalia
-
 South Africa
-
 Spain
Spain
-
 Sri Lanka
-
 Sweden
-
 Switzerland
-
 Syria
Syria
-
 Taiwan
-
 Tajikistan
-
 Tanzania
-
 Thailand
-
 Trinidad and Tobago
-
 Tunisia
-
 Turkey
-
 UAE
UAE
-
 Uganda
-
 Ukraine
-
 United Kingdom
-
United States
-
 Uruguay
-
 Uzbekistan
-
 Venezuela
-
 Vietnam
-
 Yemen
Yemen
-
 Zambia
-
 Zimbabwe
- Forex
- Crypto











