

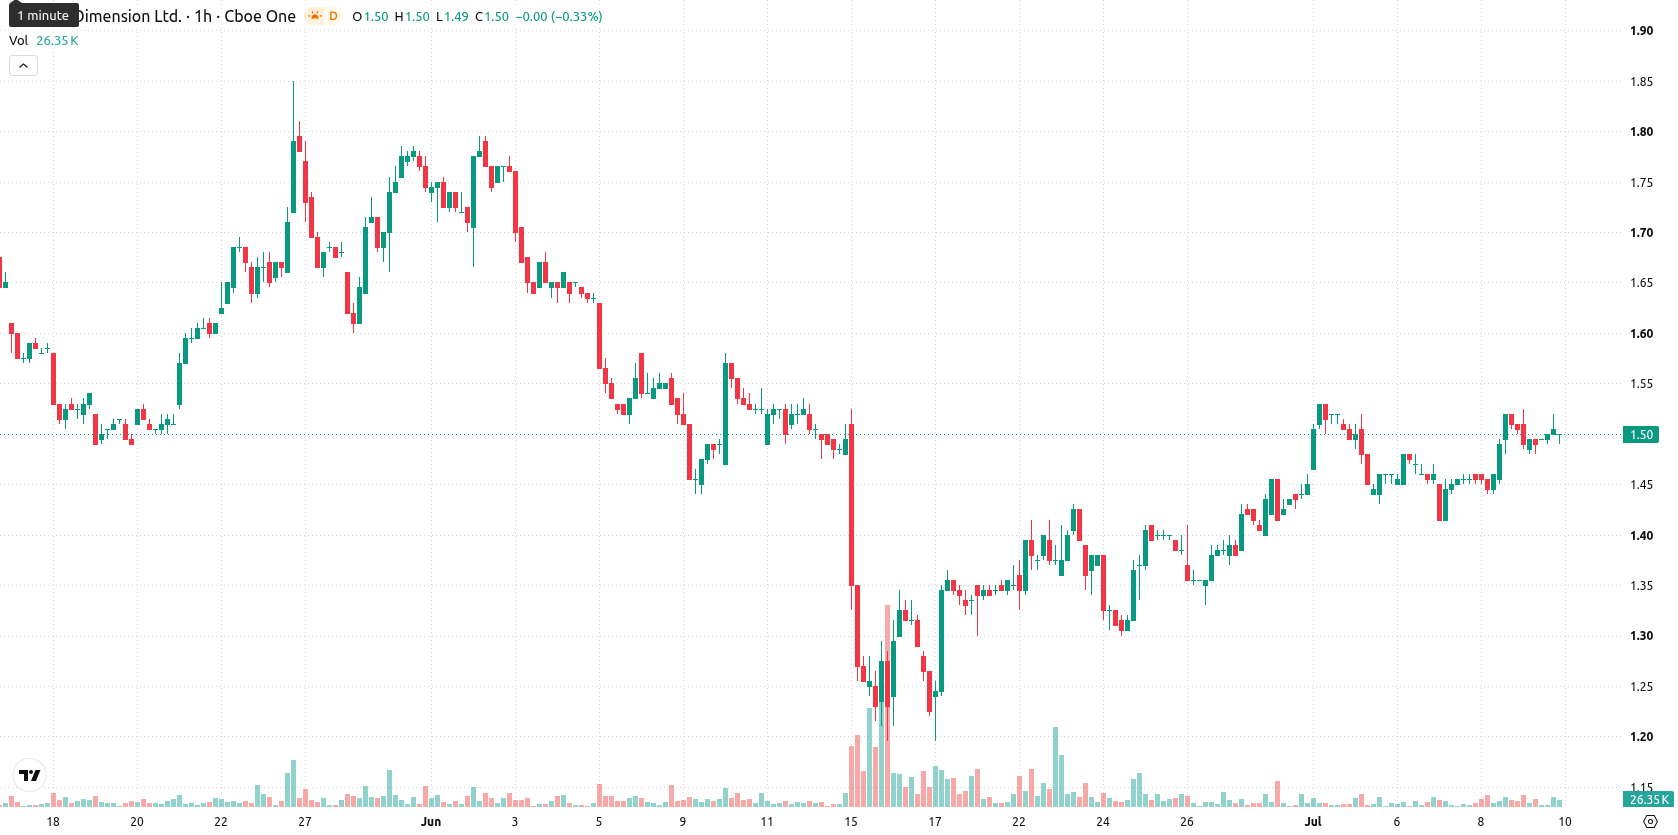
Nano Dimension (NNDM) stock is trading at $1.5 after a marginal move lower during today’s session. The price currently sits above its key short- and medium-term moving averages, but remains contained below longer-term trend levels.
 1.53
1.53
1.53
1.53
Highlights
- NNDM shows near-term bullish momentum, trading above short- to medium-term moving averages but remains below its long-term trend level.
- Technical indicators display strong intraday buying interest, but lack full consensus, with mixed oscillator signals and neutral trend strength.
- Expect NNDM to fluctuate between $1.45 and $1.55 in the coming sessions, with a high probability of upward movement while support holds at $1.47.
Active buyers as short-term signals diverge on momentum
Technical analysis shows NNDM trading above the MA-20 ($1.48) and MA-50 ($1.47) on the hourly chart, but below the MA-200 ($1.7) on the daily timeframe. The Ichimoku Kijun sits at $1.47, serving as immediate support. On the momentum side, the Moving Average Convergence Divergence (MACD) issues a Buy signal, while the Average Directional Index (ADX) remains Neutral, indicating positive but unconvincing momentum. The Relative Strength Index (RSI) is at 57.36 (Buy), with the Commodity Channel Index (CCI) and Awesome Oscillator also reflecting a Buy reading; however, the Stochastic RSI offers a Sell signal, and Bull/Bear Power denotes strong buyer dominance intraday. This mix highlights active buyer participation on short-term timeframes despite a lack of oscillator consensus.
Sideways bias prevails as volatility and upside risk increase
Looking forward, NNDM is expected to trade within a typical volatility band of $1.45 to $1.55 over the next few sessions. The probability of an upward move is assessed as very high, while the chances of a decline from current levels are low. The base case scenario anticipates ongoing sideways movement within the established corridor. Should resistance be breached, a test of the upper range is likely, whereas a break below immediate support at $1.47 could quickly trigger a bearish reversal.
Earlier, analysts noted that Nano Dimension’s price action was marked by mixed technical signals and a cautious upside bias within a defined consolidation band. The current setup reinforces this assessment, but with an uptick in short-term buying momentum, traders should watch for a decisive break above resistance as a signal for renewed directional strength.



Latest Nano Dimension News






-
 Afghanistan
-
 Albania
-
 Algeria
-
 Angola
-
 Argentina
-
 Armenia
-
 Australia
-
 Austria
-
 Azerbaijan
-
 Bahamas
-
 Bahrain
-
 Bangladesh
-
 Belarus
-
 Belgium
-
 Bolivia
-
 Botswana
-
 Brazil
-
 Brunei
-
 Bulgaria
-
 Cambodia
-
 Cameroon
-
 Canada
-
 Chile
Chile
-
 China
China
-
 Colombia
-
 Congo
Congo
-
 Costa Rica
-
 Cote d'Ivoire
-
 Croatia
-
 Cuba
Cuba
-
 Cyprus
-
 Czechia
-
 DR Congo
-
 Denmark
-
 Dominican Republic
-
 Ecuador
-
 Egypt
Egypt
-
 El Salvador
-
 Estonia
-
 Eswatini
-
 Ethiopia
-
 Finland
-
 France
-
 Georgia
-
 Germany
-
 Ghana
Ghana
-
 Greece
-
 Haiti
Haiti
-
 Hong Kong
-
 Hungary
-
 India
India
-
 Indonesia
-
 Iran, Islamic republic
-
 Iraq
Iraq
-
 Ireland
-
 Israel
-
 Italy
Italy
-
 Jamaica
-
 Japan
Japan
-
 Jordan
-
 Kazakhstan
-
 Kenya
Kenya
-
 Korea
Korea
-
 Kuwait
-
 Kyrgyzstan
-
 Laos
Laos
-
 Latvia
-
 Lebanon
-
 Lesotho
-
 Libya
Libya
-
 Lithuania
-
 Luxembourg
-
 Madagascar
-
 Malaysia
-
 Malta
Malta
-
 Mauritius
-
 Mexico
-
 Moldova
-
 Mongolia
-
 Montenegro
-
 Morocco
-
 Mozambique
-
 Myanmar
-
 Namibia
-
 Nepal
Nepal
-
 Netherlands
-
 New Zealand
-
 Nigeria
-
 North Macedonia
-
 Norway
-
 Oman
Oman
-
 Pakistan
-
 Palestine
-
 Panama
-
 Papua New Guinea
-
 Paraguay
-
 Peru
Peru
-
 Philippines
-
 Poland
-
 Portugal
-
 Puerto Rico
-
 Qatar
Qatar
-
 Reunion
-
 Romania
-
 Rwanda
-
 Saudi Arabia
-
 Serbia
-
 Singapore
-
 Slovakia
-
 Slovenia
-
 Somalia
-
 South Africa
-
 Spain
Spain
-
 Sri Lanka
-
 Sweden
-
 Switzerland
-
 Syria
Syria
-
 Taiwan
-
 Tajikistan
-
 Tanzania
-
 Thailand
-
 Trinidad and Tobago
-
 Tunisia
-
 Turkey
-
 UAE
UAE
-
 Uganda
-
 Ukraine
-
 United Kingdom
-
United States
-
 Uruguay
-
 Uzbekistan
-
 Venezuela
-
 Vietnam
-
 Yemen
Yemen
-
 Zambia
-
 Zimbabwe
- Forex
- Crypto











