
Why is Hut 8 stock falling today? High volatility drives support pressure

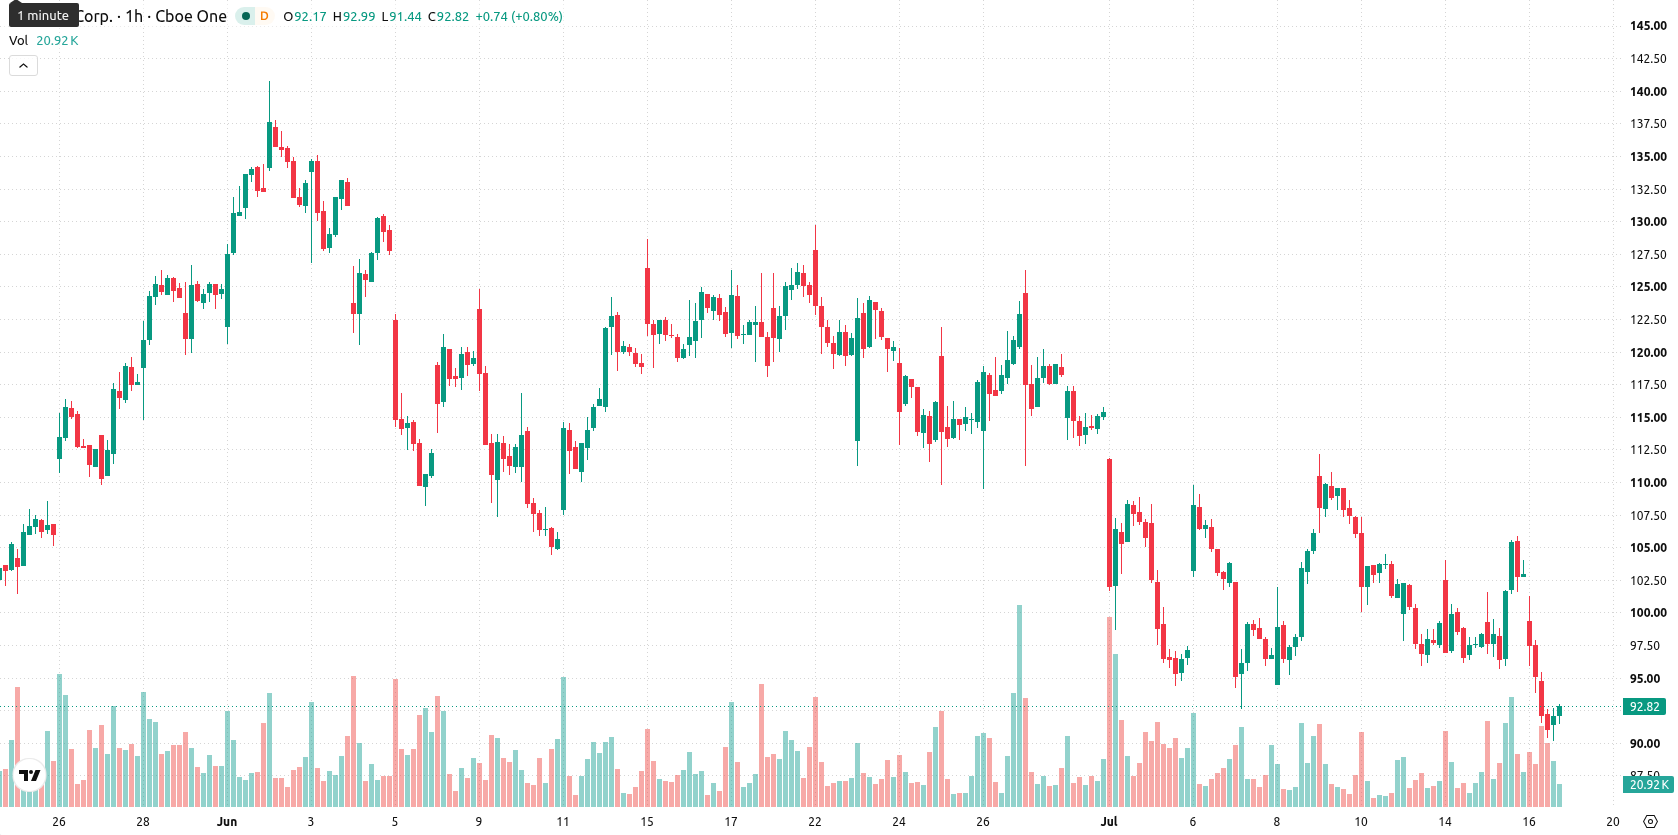
Hut 8 (HUT) stock is trading at $92.64, marking a daily drop of 10.09%. The price is currently positioned below its key moving averages, reflecting recent selling pressure.
 106.68
106.14
106.68
106.14
Highlights
- HUT/USD is exhibiting short- and medium-term bearish momentum, trading below major moving averages and showing strong downside pressure.
- Momentum and oscillator signals indicate oversold market conditions, but there are no clear signs of an imminent reversal.
- The price is expected to consolidate between $77.78 and $97.73, with a 76% probability of further decline and $77.78 as key support.
Bearish momentum confirmed as indicators signal excessive selling
On the hourly chart, HUT is trading below the MA-20 at $97.51 and the MA-50 at $100.36, while remaining above the long-term MA-200 at $66.26. Immediate resistance is set by the Ichimoku Kijun level at $98.04, with high volatility evident from a significant opening gap of 3.66. Bearish momentum is indicated, as the Moving Average Convergence Divergence (MACD) issues a Sell signal, the Average Directional Index (ADX) is Neutral, and the Relative Strength Index (RSI) stands at 37.72 (Sell). The Stochastic RSI, Commodity Channel Index (CCI), and Bull/Bear Power are all in Oversold territory, confirming strong ongoing selling pressure. The Awesome Oscillator further supports the downtrend, and price trades near today's lows.
Downside risk persists as recovery requires $98.04 breakout
Over the next several days, the expected trading range is $77.78 to $97.73. Probabilities currently favor further decline, with a 24% chance of an upward move and a 76% chance to the downside, suggesting a rebound is less likely. The baseline scenario is for HUT to consolidate within this volatility band, while a break above $98.04 could trigger recovery and a fall below $77.78 would extend the downtrend.
Previously it was reported that Hut 8 was facing heightened downside risk amid persistent selling pressure and subdued momentum signals. The latest technical breakdown and bearish momentum confirm this outlook, making a decisive move below $77.78 a critical downside risk for traders to monitor in the coming sessions.









-
 Afghanistan
-
 Albania
-
 Algeria
-
 Angola
-
 Argentina
-
 Armenia
-
 Australia
-
 Austria
-
 Azerbaijan
-
 Bahamas
-
 Bahrain
-
 Bangladesh
-
 Belarus
-
 Belgium
-
 Bolivia
-
 Botswana
-
 Brazil
-
 Brunei
-
 Bulgaria
-
 Cambodia
-
 Cameroon
-
 Canada
-
 Chile
Chile
-
 China
China
-
 Colombia
-
 Congo
Congo
-
 Costa Rica
-
 Cote d'Ivoire
-
 Croatia
-
 Cuba
Cuba
-
 Cyprus
-
 Czechia
-
 DR Congo
-
 Denmark
-
 Dominican Republic
-
 Ecuador
-
 Egypt
Egypt
-
 El Salvador
-
 Estonia
-
 Eswatini
-
 Ethiopia
-
 Finland
-
 France
-
 Georgia
-
 Germany
-
 Ghana
Ghana
-
 Greece
-
 Haiti
Haiti
-
 Hong Kong
-
 Hungary
-
 India
India
-
 Indonesia
-
 Iran, Islamic republic
-
 Iraq
Iraq
-
 Ireland
-
 Israel
-
 Italy
Italy
-
 Jamaica
-
 Japan
Japan
-
 Jordan
-
 Kazakhstan
-
 Kenya
Kenya
-
 Korea
Korea
-
 Kuwait
-
 Kyrgyzstan
-
 Laos
Laos
-
 Latvia
-
 Lebanon
-
 Lesotho
-
 Libya
Libya
-
 Lithuania
-
 Luxembourg
-
 Madagascar
-
 Malaysia
-
 Malta
Malta
-
 Mauritius
-
 Mexico
-
 Moldova
-
 Mongolia
-
 Montenegro
-
 Morocco
-
 Mozambique
-
 Myanmar
-
 Namibia
-
 Nepal
Nepal
-
 Netherlands
-
 New Zealand
-
 Nigeria
-
 North Macedonia
-
 Norway
-
 Oman
Oman
-
 Pakistan
-
 Palestine
-
 Panama
-
 Papua New Guinea
-
 Paraguay
-
 Peru
Peru
-
 Philippines
-
 Poland
-
 Portugal
-
 Puerto Rico
-
 Qatar
Qatar
-
 Reunion
-
 Romania
-
 Rwanda
-
 Saudi Arabia
-
 Serbia
-
 Singapore
-
 Slovakia
-
 Slovenia
-
 Somalia
-
 South Africa
-
 Spain
Spain
-
 Sri Lanka
-
 Sweden
-
 Switzerland
-
 Syria
Syria
-
 Taiwan
-
 Tajikistan
-
 Tanzania
-
 Thailand
-
 Trinidad and Tobago
-
 Tunisia
-
 Turkey
-
 UAE
UAE
-
 Uganda
-
 Ukraine
-
 United Kingdom
-
United States
-
 Uruguay
-
 Uzbekistan
-
 Venezuela
-
 Vietnam
-
 Yemen
Yemen
-
 Zambia
-
 Zimbabwe
- Forex
- Crypto











