
ARM declines as support pressure follows investment firm downgrade

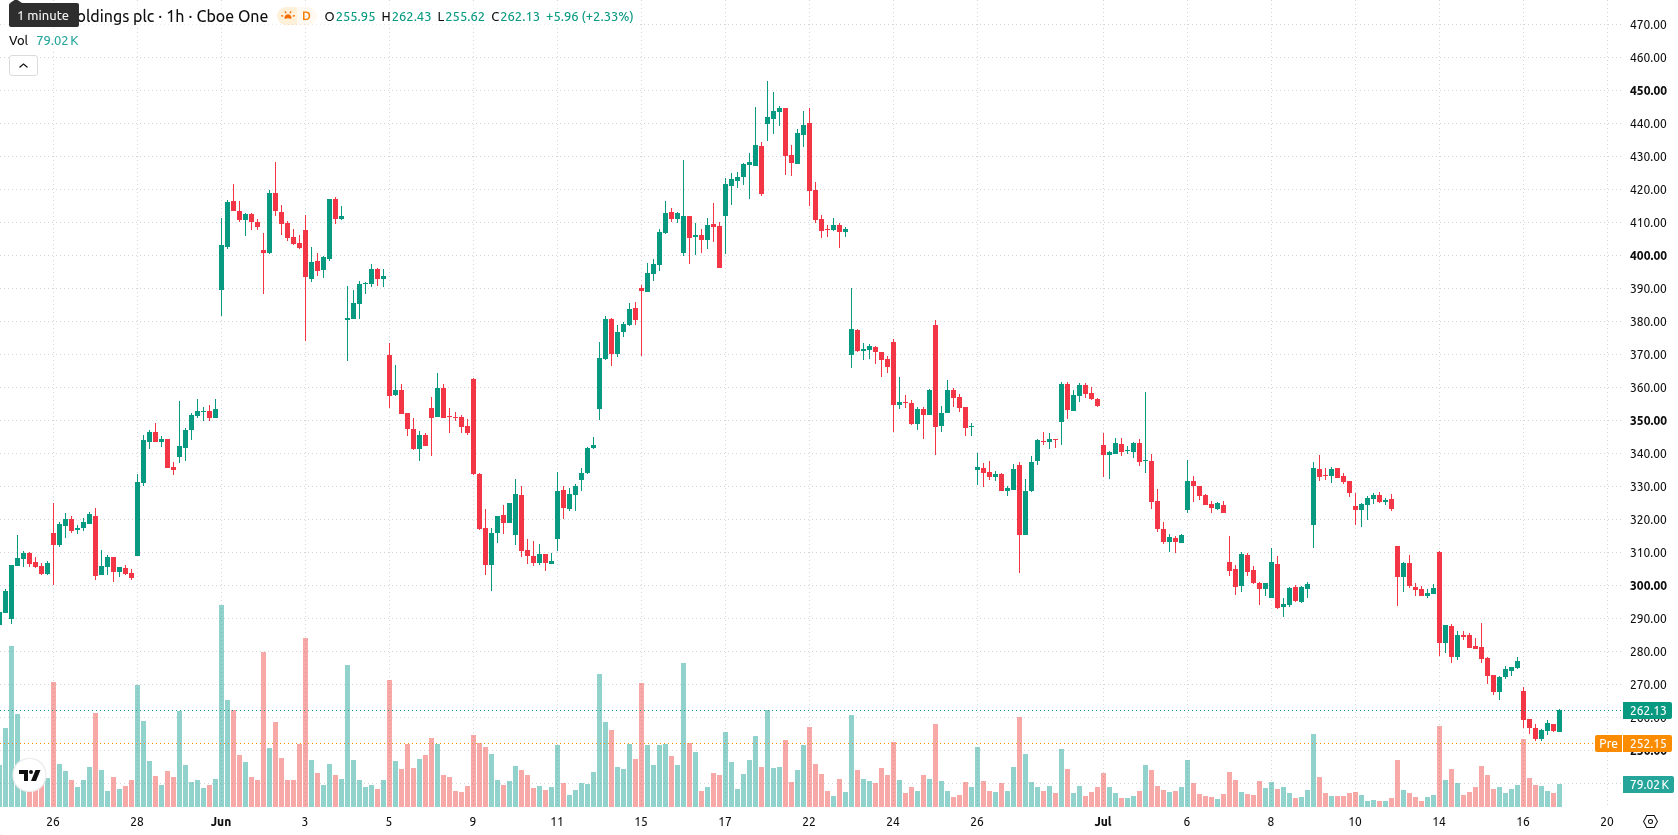
Arm Holdings (ARM) stock is trading at $262.01, down 5.41% on the day. The price sits below its key short- and medium-term moving averages, with a clear downswing in today's session.
 272.77
311.43
272.77
311.43
Highlights
- Arm trades under short- and medium-term key moving averages, reflecting sustained selling pressure after a session drop of 5.41%.
- Momentum indicators point to a bearish and oversold market profile, with only brief divergence from the Stoch RSI.
- The expected price range for the next sessions is $228.43 to $295.59, with a 74% probability of further decline.
Bearish pressure holds as major technicals point to weakness
On the hourly chart, ARM is trading below the 20-period and 50-period moving averages, pointing to sustained downward pressure in the short and medium term. The price remains above the daily 200-period moving average, providing longer-term support, while immediate resistance is defined by the Ichimoku Kijun at $281.47. Technical signals remain weak: the Moving Average Convergence Divergence (MACD) indicator shows a strong sell signal, and the Average Directional Index (ADX) confirms prevailing bearish conditions. The Relative Strength Index (RSI), Commodity Channel Index (CCI), and Bull/Bear Power all paint an oversold or selling-dominated profile, with only the Stochastic RSI showing an overbought reading—indicating mild short-term divergence amid broader negative momentum.
Downside favored as probability models indicate further risk
For the next several sessions, trading is projected within a typical volatility band from $228.43 to $295.59. Probabilistic modeling assigns a 74% likelihood of a further decline, while the odds of a rebound are lower at 26%. The baseline scenario suggests that ARM will remain in this wide range; a confirmed break above $281.47 is required to shift the outlook to bullish, while a drop below $228.43 would signal additional downside risk.
Earlier, analysts noted that persistent bearish momentum and technical weakness were dominant themes for Arm Holdings. Fresh downside signals and elevated volatility now reinforce the cautious outlook, with traders advised to monitor for a confirmed move outside the current $228.43–$295.59 range to identify the next meaningful trend.








-
 Afghanistan
-
 Albania
-
 Algeria
-
 Angola
-
 Argentina
-
 Armenia
-
 Australia
-
 Austria
-
 Azerbaijan
-
 Bahamas
-
 Bahrain
-
 Bangladesh
-
 Belarus
-
 Belgium
-
 Bolivia
-
 Botswana
-
 Brazil
-
 Brunei
-
 Bulgaria
-
 Cambodia
-
 Cameroon
-
 Canada
-
 Chile
Chile
-
 China
China
-
 Colombia
-
 Congo
Congo
-
 Costa Rica
-
 Cote d'Ivoire
-
 Croatia
-
 Cuba
Cuba
-
 Cyprus
-
 Czechia
-
 DR Congo
-
 Denmark
-
 Dominican Republic
-
 Ecuador
-
 Egypt
Egypt
-
 El Salvador
-
 Estonia
-
 Eswatini
-
 Ethiopia
-
 Finland
-
 France
-
 Georgia
-
 Germany
-
 Ghana
Ghana
-
 Greece
-
 Haiti
Haiti
-
 Hong Kong
-
 Hungary
-
 India
India
-
 Indonesia
-
 Iran, Islamic republic
-
 Iraq
Iraq
-
 Ireland
-
 Israel
-
 Italy
Italy
-
 Jamaica
-
 Japan
Japan
-
 Jordan
-
 Kazakhstan
-
 Kenya
Kenya
-
 Korea
Korea
-
 Kuwait
-
 Kyrgyzstan
-
 Laos
Laos
-
 Latvia
-
 Lebanon
-
 Lesotho
-
 Libya
Libya
-
 Lithuania
-
 Luxembourg
-
 Madagascar
-
 Malaysia
-
 Malta
Malta
-
 Mauritius
-
 Mexico
-
 Moldova
-
 Mongolia
-
 Montenegro
-
 Morocco
-
 Mozambique
-
 Myanmar
-
 Namibia
-
 Nepal
Nepal
-
 Netherlands
-
 New Zealand
-
 Nigeria
-
 North Macedonia
-
 Norway
-
 Oman
Oman
-
 Pakistan
-
 Palestine
-
 Panama
-
 Papua New Guinea
-
 Paraguay
-
 Peru
Peru
-
 Philippines
-
 Poland
-
 Portugal
-
 Puerto Rico
-
 Qatar
Qatar
-
 Reunion
-
 Romania
-
 Rwanda
-
 Saudi Arabia
-
 Serbia
-
 Singapore
-
 Slovakia
-
 Slovenia
-
 Somalia
-
 South Africa
-
 Spain
Spain
-
 Sri Lanka
-
 Sweden
-
 Switzerland
-
 Syria
Syria
-
 Taiwan
-
 Tajikistan
-
 Tanzania
-
 Thailand
-
 Trinidad and Tobago
-
 Tunisia
-
 Turkey
-
 UAE
UAE
-
 Uganda
-
 Ukraine
-
 United Kingdom
-
United States
-
 Uruguay
-
 Uzbekistan
-
 Venezuela
-
 Vietnam
-
 Yemen
Yemen
-
 Zambia
-
 Zimbabwe
- Forex
- Crypto











