
Why is National Grid stock flat today? Price consolidates within the GBX1,223–GBX1,274 range

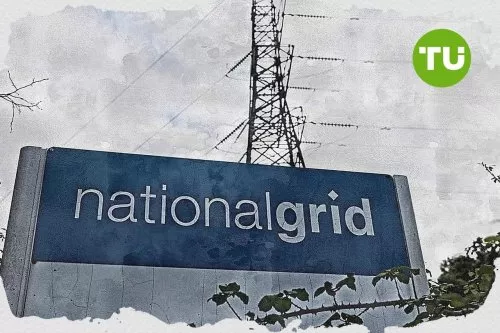
National Grid (NG) stock is trading at GBX1,249 after a modest decrease on the day. The price remains above key moving averages on multiple timeframes.
 1255.00
1262.50
1255.00
1262.50
Highlights
- Price maintains a bullish structure above key moving averages across short, medium, and long-term timeframes.
- Momentum signals are mixed but generally favor buyers, with most indicators positive and intraday bias moderately bullish.
- Price is expected to range between GBX1,223 and GBX1,274 over the next 2–3 days, with a 70% probability of an upward move.
Mixed momentum as price sustains above key technical supports
On the technical front, NG is trading above the MA-20 and MA-50 on the hourly chart at GBX1,236, holding firm above the MA-200 at GBX1,224. The Ichimoku Kijun level at GBX1,233 is acting as immediate support. Momentum signals are mixed: the Moving Average Convergence Divergence (MACD) shows a buy, the Average Directional Index (ADX) indicates neutral trend strength, and the Relative Strength Index (RSI) stands at 54.89, suggesting a mild bullish setup. Both the Stochastic RSI and Commodity Channel Index (CCI) are neutral, along with the Awesome Oscillator, pointing to a lack of overbought or oversold signals. Bull/Bear Power currently favors buyers intraday, though momentum oscillators overall produce a mixed short-term technical outlook.
Directional bias emerges as range-bound scenario drives near-term risk
For the next two to three trading days, NG is expected to move within a GBX1,223 to GBX1,274 range based on typical volatility. There is a 70% probability of an upward move within this band. The baseline scenario is for the price to hold its current range. A bullish breakout above resistance could drive the price toward the upper end of the forecast, while a loss of support at the Ichimoku Kijun level of GBX1,233 may see a retest of the lower boundary near GBX1,223.
Earlier, analysts noted that growing reliance on demand flexibility is making the management of Britain’s electricity grid more complex amid the transition to renewables. In the near term, National Grid’s price action remains technically resilient within a defined range, but traders should monitor for a decisive move above resistance or a breakdown below the Ichimoku Kijun level to signal the next directional shift.


Latest National Grid News






-
 Afghanistan
-
 Albania
-
 Algeria
-
 Angola
-
 Argentina
-
 Armenia
-
 Australia
-
 Austria
-
 Azerbaijan
-
 Bahamas
-
 Bahrain
-
 Bangladesh
-
 Belarus
-
 Belgium
-
 Bolivia
-
 Botswana
-
 Brazil
-
 Brunei
-
 Bulgaria
-
 Cambodia
-
 Cameroon
-
 Canada
-
 Chile
Chile
-
 China
China
-
 Colombia
-
 Congo
Congo
-
 Costa Rica
-
 Cote d'Ivoire
-
 Croatia
-
 Cuba
Cuba
-
 Cyprus
-
 Czechia
-
 DR Congo
-
 Denmark
-
 Dominican Republic
-
 Ecuador
-
 Egypt
Egypt
-
 El Salvador
-
 Estonia
-
 Eswatini
-
 Ethiopia
-
 Finland
-
 France
-
 Georgia
-
 Germany
-
 Ghana
Ghana
-
 Greece
-
 Haiti
Haiti
-
 Hong Kong
-
 Hungary
-
 India
India
-
 Indonesia
-
 Iran, Islamic republic
-
 Iraq
Iraq
-
 Ireland
-
 Israel
-
 Italy
Italy
-
 Jamaica
-
 Japan
Japan
-
 Jordan
-
 Kazakhstan
-
 Kenya
Kenya
-
 Korea
Korea
-
 Kuwait
-
 Kyrgyzstan
-
 Laos
Laos
-
 Latvia
-
 Lebanon
-
 Lesotho
-
 Libya
Libya
-
 Lithuania
-
 Luxembourg
-
 Madagascar
-
 Malaysia
-
 Malta
Malta
-
 Mauritius
-
 Mexico
-
 Moldova
-
 Mongolia
-
 Montenegro
-
 Morocco
-
 Mozambique
-
 Myanmar
-
 Namibia
-
 Nepal
Nepal
-
 Netherlands
-
 New Zealand
-
 Nigeria
-
 North Macedonia
-
 Norway
-
 Oman
Oman
-
 Pakistan
-
 Palestine
-
 Panama
-
 Papua New Guinea
-
 Paraguay
-
 Peru
Peru
-
 Philippines
-
 Poland
-
 Portugal
-
 Puerto Rico
-
 Qatar
Qatar
-
 Reunion
-
 Romania
-
 Rwanda
-
 Saudi Arabia
-
 Serbia
-
 Singapore
-
 Slovakia
-
 Slovenia
-
 Somalia
-
 South Africa
-
 Spain
Spain
-
 Sri Lanka
-
 Sweden
-
 Switzerland
-
 Syria
Syria
-
 Taiwan
-
 Tajikistan
-
 Tanzania
-
 Thailand
-
 Trinidad and Tobago
-
 Tunisia
-
 Turkey
-
 UAE
UAE
-
 Uganda
-
 Ukraine
-
 United Kingdom
-
United States
-
 Uruguay
-
 Uzbekistan
-
 Venezuela
-
 Vietnam
-
 Yemen
Yemen
-
 Zambia
-
 Zimbabwe
- Forex
- Crypto











