
NVDA shares maintain trend strength supported by robust data center revenue: weekly report

Nvidia Corporation (NVDA) is currently trading at $202.68, ending the week unchanged for a neutral 0.00% move. The asset remains above all key weekly moving averages — MA-20 ($198.07), MA-50 ($189.11), and MA-200 ($106.70) — confirming a medium- to long-term bullish trend, with the MA-20 now providing dynamic support near recent lows.
 206.49
213.81
206.49
213.81
Highlights
- NVDA maintains a medium- to long-term bullish trend as it trades above all major weekly moving averages.
- Price action has consolidated at the bottom of the weekly range, with mixed momentum and overbought oscillator signals.
- For the coming week, NVDA is expected to range between $190.90 and $203.96, with a 75% probability of upward movement if resistance breaks.
Data center surge boosts sentiment as institutional flows remain active
Nvidia reported quarterly revenue of $46.7 billion, driven by robust data center sales reaching approximately $41 billion amid sustained demand for AI infrastructure. The company continues expanding its global partnerships, notably in Japan, while navigating competitive pressures from emerging AI firms and major customers developing their own chips. Recently, several major institutional investors, including Sumitomo Mitsui Trust Group Inc. and Main Street Research LLC, adjusted their holdings in Nvidia as interest in the company remains strong. Nvidia's market capitalization remains close to $5 trillion.
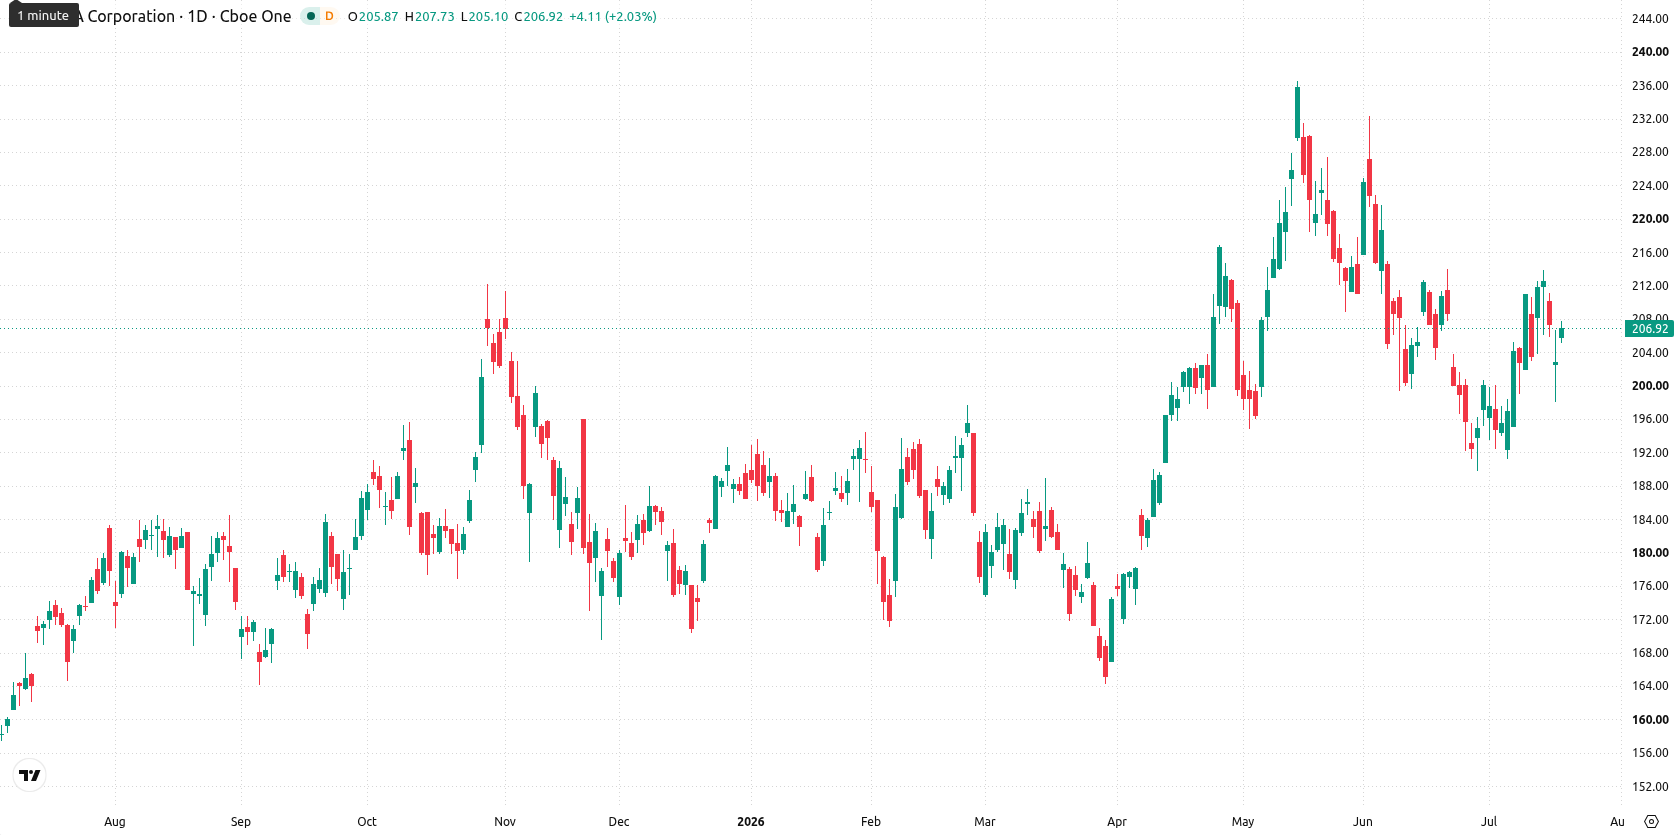
Bullish bias holds as weekly momentum and oscillators show mixed signals
Technical signals on the weekly chart reflect consolidation with bullish characteristics. NVDA remains firmly above its MA-20, MA-50, and MA-200, indicating ongoing trend strength. Weekly MACD shows a "Strong Buy" and ADX issues a "Buy" signal, reflecting positive momentum, while oscillators such as the Stochastic RSI ("Sell") and CCI ("Neutral") point to limited short-term upside, suggesting the price is neither oversold nor overbought. The Bull/Bear Power indicator registers an "Overbought" reading, and the Awesome Oscillator is neutral, highlighting a pause near support levels amid mixed momentum and oscillator signals.
Modest gains favored next week as breakout levels define risk
Over the next 5 trading days, NVDA is expected to trade within a weekly range of $190.90 to $203.96. With 75% of key weekly indicators signaling upward momentum, the baseline scenario favors sideways or modest upward movement. A bullish breakout above $203.96 would open the way for further gains, while a move below $190.90 could prompt a deeper pullback toward broader support levels.
Earlier, analysts noted that Nvidia's expanding role in AI and continued demand for high-performance chips have underpinned both sector growth and investor enthusiasm. As the current technical setup points to consolidation with bullish momentum, traders should closely monitor price action around the $203.96 resistance, as a breakout could signal renewed upside in line with the asset’s long-term trend.


Latest NVDA News






-
 Afghanistan
-
 Albania
-
 Algeria
-
 Angola
-
 Argentina
-
 Armenia
-
 Australia
-
 Austria
-
 Azerbaijan
-
 Bahamas
-
 Bahrain
-
 Bangladesh
-
 Belarus
-
 Belgium
-
 Bolivia
-
 Botswana
-
 Brazil
-
 Brunei
-
 Bulgaria
-
 Cambodia
-
 Cameroon
-
 Canada
-
 Chile
Chile
-
 China
China
-
 Colombia
-
 Congo
Congo
-
 Costa Rica
-
 Cote d'Ivoire
-
 Croatia
-
 Cuba
Cuba
-
 Cyprus
-
 Czechia
-
 DR Congo
-
 Denmark
-
 Dominican Republic
-
 Ecuador
-
 Egypt
Egypt
-
 El Salvador
-
 Estonia
-
 Eswatini
-
 Ethiopia
-
 Finland
-
 France
-
 Georgia
-
 Germany
-
 Ghana
Ghana
-
 Greece
-
 Haiti
Haiti
-
 Hong Kong
-
 Hungary
-
 India
India
-
 Indonesia
-
 Iran, Islamic republic
-
 Iraq
Iraq
-
 Ireland
-
 Israel
-
 Italy
Italy
-
 Jamaica
-
 Japan
Japan
-
 Jordan
-
 Kazakhstan
-
 Kenya
Kenya
-
 Korea
Korea
-
 Kuwait
-
 Kyrgyzstan
-
 Laos
Laos
-
 Latvia
-
 Lebanon
-
 Lesotho
-
 Libya
Libya
-
 Lithuania
-
 Luxembourg
-
 Madagascar
-
 Malaysia
-
 Malta
Malta
-
 Mauritius
-
 Mexico
-
 Moldova
-
 Mongolia
-
 Montenegro
-
 Morocco
-
 Mozambique
-
 Myanmar
-
 Namibia
-
 Nepal
Nepal
-
 Netherlands
-
 New Zealand
-
 Nigeria
-
 North Macedonia
-
 Norway
-
 Oman
Oman
-
 Pakistan
-
 Palestine
-
 Panama
-
 Papua New Guinea
-
 Paraguay
-
 Peru
Peru
-
 Philippines
-
 Poland
-
 Portugal
-
 Puerto Rico
-
 Qatar
Qatar
-
 Reunion
-
 Romania
-
 Rwanda
-
 Saudi Arabia
-
 Serbia
-
 Singapore
-
 Slovakia
-
 Slovenia
-
 Somalia
-
 South Africa
-
 Spain
Spain
-
 Sri Lanka
-
 Sweden
-
 Switzerland
-
 Syria
Syria
-
 Taiwan
-
 Tajikistan
-
 Tanzania
-
 Thailand
-
 Trinidad and Tobago
-
 Tunisia
-
 Turkey
-
 UAE
UAE
-
 Uganda
-
 Ukraine
-
 United Kingdom
-
United States
-
 Uruguay
-
 Uzbekistan
-
 Venezuela
-
 Vietnam
-
 Yemen
Yemen
-
 Zambia
-
 Zimbabwe
- Forex
- Crypto











