

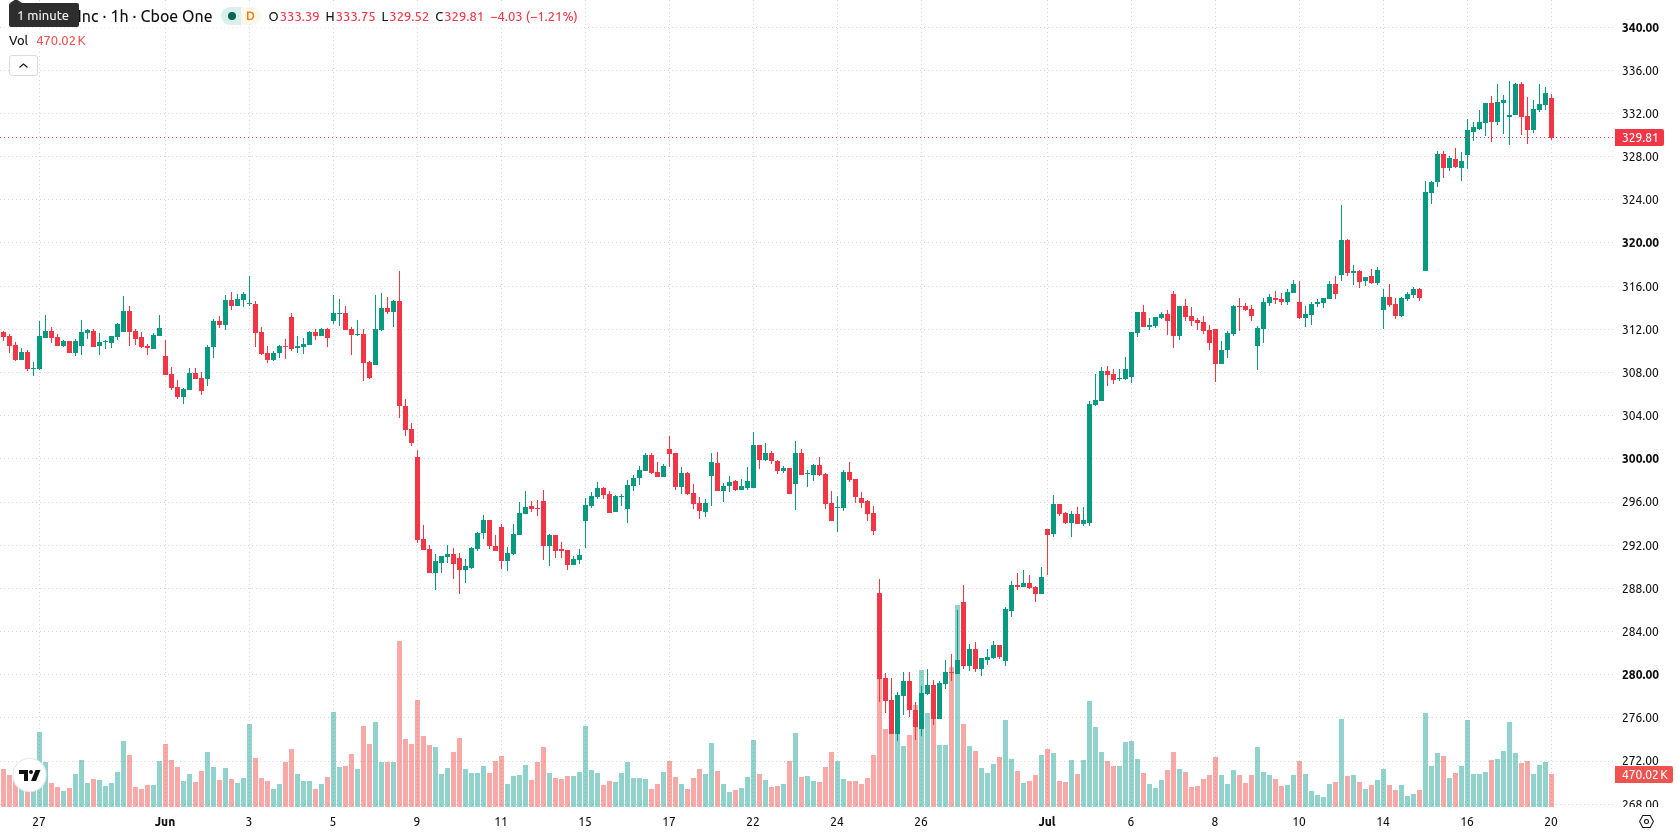
Apple Inc. (AAPL) stock is trading at $330.30, reflecting a daily move to the downside. The price is currently positioned below its short-term averages but remains above key medium-term and long-term moving averages.
 329.73
334.86
329.73
334.86
Highlights
- Apple secured Chinese regulatory approval to deploy Apple Intelligence features, enhancing its opportunity to drive ecosystem and device growth in a key international market.
- Ongoing legal challenges—including trade secret litigation against OpenAI, DOJ scrutiny over iPhone monopoly claims, and CEO succession in 2026—add strategic and operational complexity.
- Despite recent selling pressure, AAPL is expected to trade sideways within a $320.04 to $340.56 range, as technical signals conflict and volatility persists.
China approval and leadership change as legal tensions persist
Apple expanded the availability of its Apple Intelligence features in China following regulatory approval for eligible devices, granting the company access to a key market for advanced AI offerings, according to Kalkinemedia. The regulatory development may support future device adoption and ecosystem growth. In parallel, Apple filed a trade secrets lawsuit against OpenAI alleging systematic theft and significant employee poaching, while also making multiple settlement offers to the U.S. Department of Justice regarding the ongoing iPhone monopoly lawsuit and unresolved Apple Watch interoperability issues. An upcoming CEO transition from Tim Cook to John Ternus is also scheduled for late August 2026, introducing leadership change into the broader context, though price action has remained under broader selling pressure.
Mixed momentum as intraday signals diverge around support
On the hourly chart, AAPL is trading below the MA-20 while holding above both the MA-50 and the MA-200 on the daily chart. The Ichimoku Kijun stands at $324.78, acting as immediate support. The technical landscape is mixed: MACD is currently showing strong bullish momentum, but ADX indicates that sellers maintain dominance. RSI is at 54.16 (Buy), while Stochastic RSI is in oversold territory and CCI remains neutral. Bull/Bear Power signals buyers have an intraday advantage, whereas the Awesome Oscillator is neutral. Divergent readings across these indicators highlight intraday uncertainty, as momentum and oscillator signals do not fully align with the observed price weakness.
Range-bound trading likely as volatility and breakout risks persist
Over the next two to three trading days, AAPL is likely to trade within the $320.04 to $340.56 range, reflecting typical volatility for the stock. The baseline scenario calls for sideways movement inside this range. Should momentum align to the upside, the price may break through resistance and extend higher. Conversely, a drop below immediate support would open the way for further downside if selling resumes control.
Previously, analysts noted that Apple's expanding AI initiatives and ongoing innovations could act as catalysts for future revenue growth and investor sentiment. The latest developments—ranging from regulatory advances in China to legal and leadership shifts—broaden the narrative, making it important for investors to monitor the stock’s response to evolving risk factors as the trading range tightens and volatility persists.








-
 Afghanistan
-
 Albania
-
 Algeria
-
 Angola
-
 Argentina
-
 Armenia
-
 Australia
-
 Austria
-
 Azerbaijan
-
 Bahamas
-
 Bahrain
-
 Bangladesh
-
 Belarus
-
 Belgium
-
 Bolivia
-
 Botswana
-
 Brazil
-
 Brunei
-
 Bulgaria
-
 Cambodia
-
 Cameroon
-
 Canada
-
 Chile
Chile
-
 China
China
-
 Colombia
-
 Congo
Congo
-
 Costa Rica
-
 Cote d'Ivoire
-
 Croatia
-
 Cuba
Cuba
-
 Cyprus
-
 Czechia
-
 DR Congo
-
 Denmark
-
 Dominican Republic
-
 Ecuador
-
 Egypt
Egypt
-
 El Salvador
-
 Estonia
-
 Eswatini
-
 Ethiopia
-
 Finland
-
 France
-
 Georgia
-
 Germany
-
 Ghana
Ghana
-
 Greece
-
 Haiti
Haiti
-
 Hong Kong
-
 Hungary
-
 India
India
-
 Indonesia
-
 Iran, Islamic republic
-
 Iraq
Iraq
-
 Ireland
-
 Israel
-
 Italy
Italy
-
 Jamaica
-
 Japan
Japan
-
 Jordan
-
 Kazakhstan
-
 Kenya
Kenya
-
 Korea
Korea
-
 Kuwait
-
 Kyrgyzstan
-
 Laos
Laos
-
 Latvia
-
 Lebanon
-
 Lesotho
-
 Libya
Libya
-
 Lithuania
-
 Luxembourg
-
 Madagascar
-
 Malaysia
-
 Malta
Malta
-
 Mauritius
-
 Mexico
-
 Moldova
-
 Mongolia
-
 Montenegro
-
 Morocco
-
 Mozambique
-
 Myanmar
-
 Namibia
-
 Nepal
Nepal
-
 Netherlands
-
 New Zealand
-
 Nigeria
-
 North Macedonia
-
 Norway
-
 Oman
Oman
-
 Pakistan
-
 Palestine
-
 Panama
-
 Papua New Guinea
-
 Paraguay
-
 Peru
Peru
-
 Philippines
-
 Poland
-
 Portugal
-
 Puerto Rico
-
 Qatar
Qatar
-
 Reunion
-
 Romania
-
 Rwanda
-
 Saudi Arabia
-
 Serbia
-
 Singapore
-
 Slovakia
-
 Slovenia
-
 Somalia
-
 South Africa
-
 Spain
Spain
-
 Sri Lanka
-
 Sweden
-
 Switzerland
-
 Syria
Syria
-
 Taiwan
-
 Tajikistan
-
 Tanzania
-
 Thailand
-
 Trinidad and Tobago
-
 Tunisia
-
 Turkey
-
 UAE
UAE
-
 Uganda
-
 Ukraine
-
 United Kingdom
-
United States
-
 Uruguay
-
 Uzbekistan
-
 Venezuela
-
 Vietnam
-
 Yemen
Yemen
-
 Zambia
-
 Zimbabwe
- Forex
- Crypto











