
Interactive Brokers stock tests $92.82 resistance as customer accounts grow 34% year-over-year

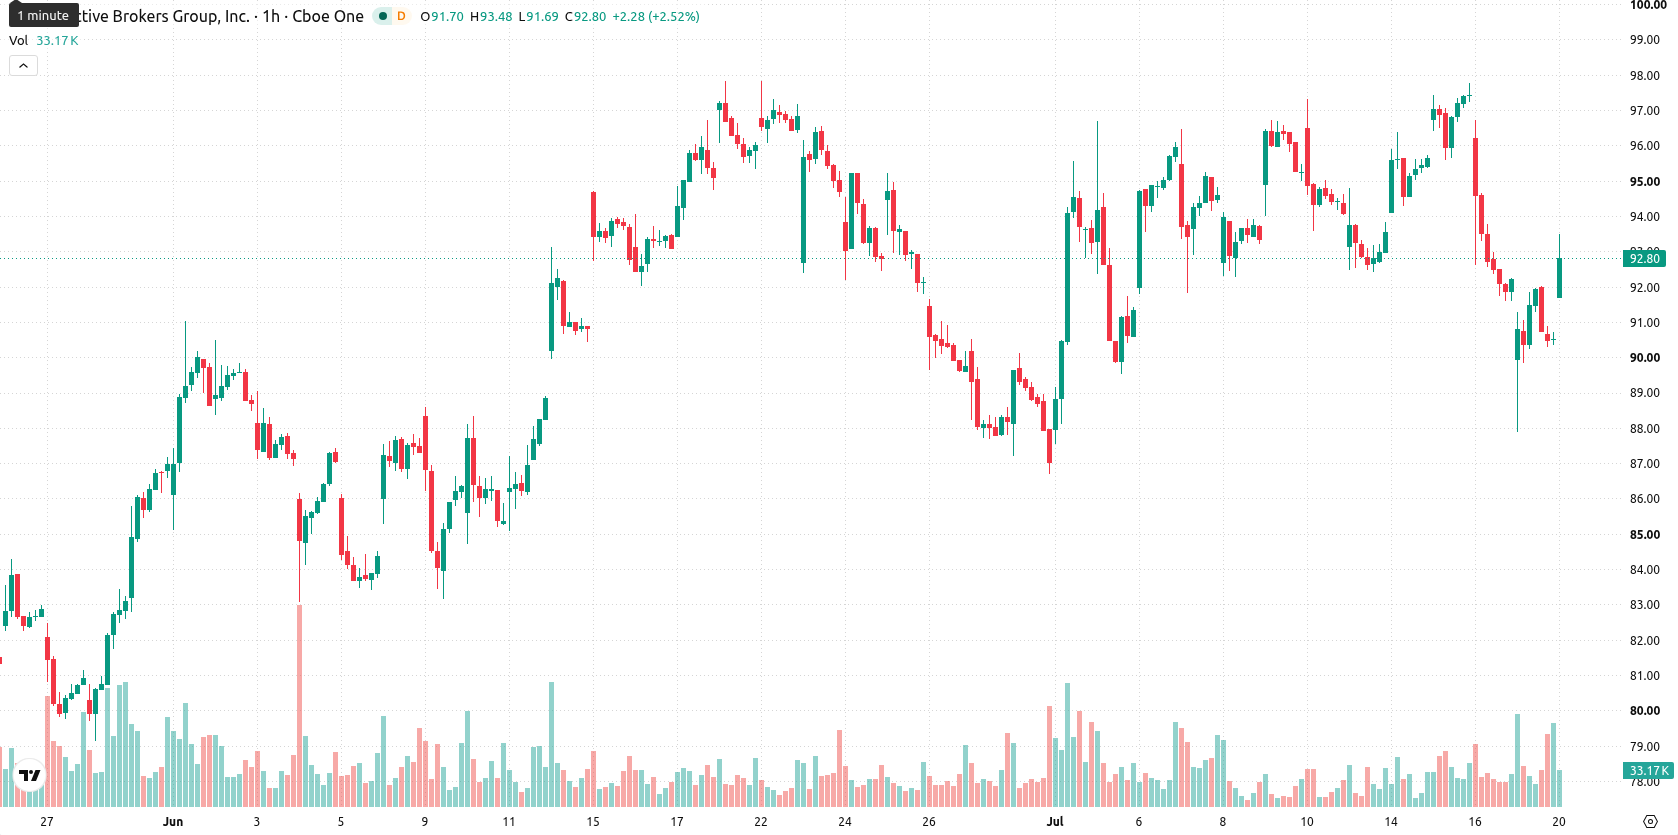
Interactive Brokers (IBKR) stock is trading at $92.6, up 2.29% on the day. The price currently sits below its key short- and medium-term moving averages, but above longer-term trend levels.
 93.33
97.77
93.33
97.77
Highlights
- Interactive Brokers' customer accounts surged 34% year-over-year, underscoring strong demand and effective platform scaling.
- This rapid account growth supports heightened expectations for future revenue and earnings ahead of the Q2 2026 update.
- IBKR/USD faces short-term downside pressure amid mixed momentum signals, with consolidation expected between $88.19 and $97.01 barring a breakout from key resistance or support.
Account growth fuels optimism as client demand accelerates
Interactive Brokers has expanded its customer accounts by 34% over the past year, according to Fool. This sharp growth signals robust client acquisition and operational scaling, which may lift expectations for future revenue and earnings potential as the company approaches its second-quarter 2026 update. Such expansion directly reflects ongoing demand for the firm's brokerage services, providing fundamental support for current buying interest.
Negative momentum dominates as price nears short-term resistance
On the technical front, IBKR is trading below its MA-20 at $93.13 and MA-50 at $94.19 on the hourly chart, while maintaining a position above the MA-200 at $74.97 on the daily chart. The Ichimoku Kijun sits at $92.82, acting as immediate resistance. MACD and ADX signal negative momentum in the short term, with RSI at 44.97 also in Sell territory. However, Stochastic RSI reads overbought, CCI is neutral, and the Awesome Oscillator shows no clear trend, while Bull/Bear Power indicates that intraday buyers have maintained control amid opposing momentum signals.
Neutral outlook holds as price tests volatility boundaries
Over the next several trading days, IBKR is likely to consolidate within a volatility band of $88.19 to $97.01, with up and down probabilities balanced at 50%. A clear bullish scenario would require a breakout above the $92.82 resistance level, opening scope for further upside. Conversely, failure to hold above $88.19 may expose the stock to additional downward risk.
Previously it was reported that Interactive Brokers faced persistent bearish pressures, with technical signals suggesting a period of consolidation and downside risk. With the current combination of robust account growth and mixed momentum indicators, investors should closely watch the $92.82 resistance as a potential pivot point for near-term price action.


Latest Interactive Brokers News






-
 Afghanistan
-
 Albania
-
 Algeria
-
 Angola
-
 Argentina
-
 Armenia
-
 Australia
-
 Austria
-
 Azerbaijan
-
 Bahamas
-
 Bahrain
-
 Bangladesh
-
 Belarus
-
 Belgium
-
 Bolivia
-
 Botswana
-
 Brazil
-
 Brunei
-
 Bulgaria
-
 Cambodia
-
 Cameroon
-
 Canada
-
 Chile
Chile
-
 China
China
-
 Colombia
-
 Congo
Congo
-
 Costa Rica
-
 Cote d'Ivoire
-
 Croatia
-
 Cuba
Cuba
-
 Cyprus
-
 Czechia
-
 DR Congo
-
 Denmark
-
 Dominican Republic
-
 Ecuador
-
 Egypt
Egypt
-
 El Salvador
-
 Estonia
-
 Eswatini
-
 Ethiopia
-
 Finland
-
 France
-
 Georgia
-
 Germany
-
 Ghana
Ghana
-
 Greece
-
 Haiti
Haiti
-
 Hong Kong
-
 Hungary
-
 India
India
-
 Indonesia
-
 Iran, Islamic republic
-
 Iraq
Iraq
-
 Ireland
-
 Israel
-
 Italy
Italy
-
 Jamaica
-
 Japan
Japan
-
 Jordan
-
 Kazakhstan
-
 Kenya
Kenya
-
 Korea
Korea
-
 Kuwait
-
 Kyrgyzstan
-
 Laos
Laos
-
 Latvia
-
 Lebanon
-
 Lesotho
-
 Libya
Libya
-
 Lithuania
-
 Luxembourg
-
 Madagascar
-
 Malaysia
-
 Malta
Malta
-
 Mauritius
-
 Mexico
-
 Moldova
-
 Mongolia
-
 Montenegro
-
 Morocco
-
 Mozambique
-
 Myanmar
-
 Namibia
-
 Nepal
Nepal
-
 Netherlands
-
 New Zealand
-
 Nigeria
-
 North Macedonia
-
 Norway
-
 Oman
Oman
-
 Pakistan
-
 Palestine
-
 Panama
-
 Papua New Guinea
-
 Paraguay
-
 Peru
Peru
-
 Philippines
-
 Poland
-
 Portugal
-
 Puerto Rico
-
 Qatar
Qatar
-
 Reunion
-
 Romania
-
 Rwanda
-
 Saudi Arabia
-
 Serbia
-
 Singapore
-
 Slovakia
-
 Slovenia
-
 Somalia
-
 South Africa
-
 Spain
Spain
-
 Sri Lanka
-
 Sweden
-
 Switzerland
-
 Syria
Syria
-
 Taiwan
-
 Tajikistan
-
 Tanzania
-
 Thailand
-
 Trinidad and Tobago
-
 Tunisia
-
 Turkey
-
 UAE
UAE
-
 Uganda
-
 Ukraine
-
 United Kingdom
-
United States
-
 Uruguay
-
 Uzbekistan
-
 Venezuela
-
 Vietnam
-
 Yemen
Yemen
-
 Zambia
-
 Zimbabwe
- Forex
- Crypto












