


S&P 500 Index (SPX) fell 1.3% as broad weakness in technology and chipmaker stocks drove declines, accompanied by mixed earnings results from major banks and concerns about future profitability. The quality of the move is supported by the index slipping below its 20-day and 50-day moving averages, indicating short- and medium-term selling pressure despite intact long-term bullish structure.
 7412.76
7649.65
Highlights
- Technology stocks led S&P 500 declines and financials showed mixed responses as large banks reported earnings.
- Earnings growth was concentrated in technology and energy, but rising AI infrastructure spending raised concerns for cash flow and buybacks.
- The S&P 500 trades below short- and medium-term moving averages with mixed momentum signals and a forecasted five-day range of 7,658 to 7,748.
Tech weakness and AI spending pressure equity flows and sector sentiment
Recent reports showed mixed results across major S&P 500 sectors. Technology stocks led the declines, while financials showed varied responses following earnings from large banks including JPMorgan, Goldman Sachs, Citigroup, and Wells Fargo. Chipmaker stocks also contributed to the index's weakness. Earnings growth remained concentrated in technology and energy sectors, and rising capital expenditures on AI infrastructure raised concerns regarding free cash flow and buyback capacity, though price action has remained under broader selling pressure.
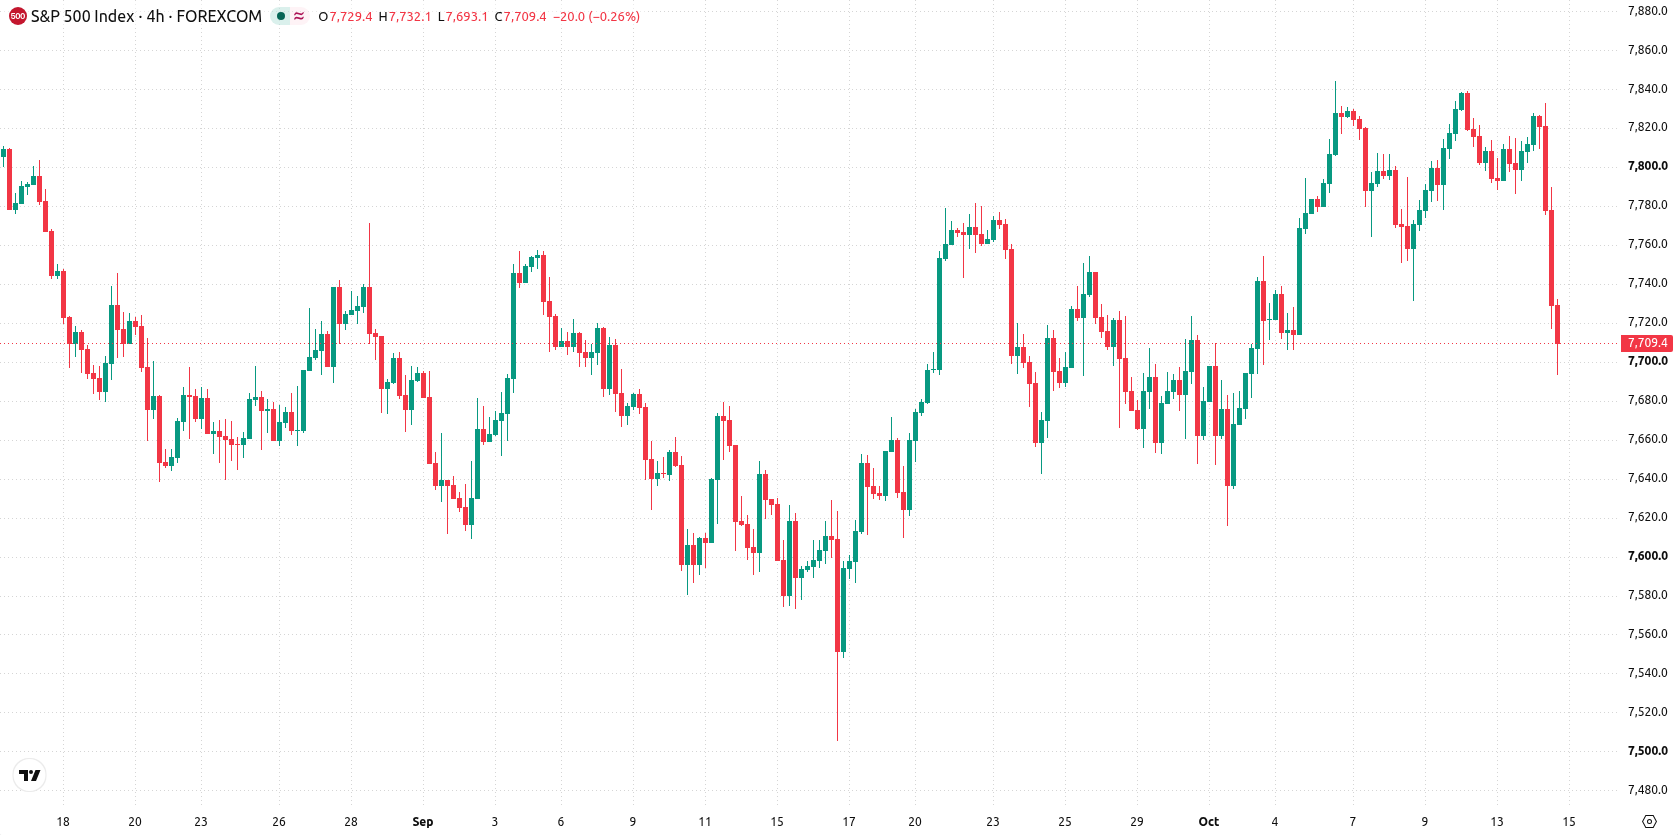
Short-term bearish signals prevail as mixed momentum tempers trend
The SPX slipped below its 20-day and 50-day moving averages, set at 7,725 and 7,707, and is trading at 7,703, but remains above the 200-day moving average at 7,259. This configuration signals short- and medium-term selling pressure, while the long-term bullish structure persists due to the relationship between the 50-day and 200-day averages. Key near-term resistance is at 7,707, with immediate support at the Ichimoku Kijun level of 7,676. Momentum indicators are mixed: the MACD shows underlying buy momentum, the ADX at 7.38 suggests weak trend strength, RSI and CCI have both triggered buy signals, but the Stochastic RSI has turned to a sell. Bull/Bear Power (BBP) indicates buyers remain dominant, though in overbought territory. Today's session was marked by a downside gap and steady selling, with volatility subdued at 0.40%.
Earlier, analysts noted that a select group of S&P 500 companies were expected to deliver better-than-anticipated earnings, potentially providing support for the broader index. With current technicals signaling increased short- and medium-term selling pressure amid mixed sector results, traders should closely monitor 7,707 as the pivotal resistance level for a potential upside breakout in the coming sessions.











-
 Afghanistan
-
 Albania
-
 Algeria
-
 Angola
-
 Argentina
-
 Armenia
-
 Australia
-
 Austria
-
 Azerbaijan
-
 Bahamas
-
 Bahrain
-
 Bangladesh
-
 Belarus
-
 Belgium
-
 Bolivia
-
 Botswana
-
 Brazil
-
 Brunei
-
 Bulgaria
-
 Cambodia
-
 Cameroon
-
 Canada
-
 Chile
-
 China
-
 Colombia
-
 Congo
-
 Costa Rica
-
 Cote d'Ivoire
-
 Croatia
-
 Cuba
-
 Cyprus
-
 Czechia
-
 DR Congo
-
 Denmark
-
 Dominican Republic
-
 Ecuador
-
 Egypt
-
 El Salvador
-
 Estonia
-
 Eswatini
-
 Ethiopia
-
 Finland
-
 France
-
 Georgia
-
 Germany
-
 Ghana
-
 Greece
-
 Haiti
-
 Hong Kong
-
 Hungary
-
 India
-
 Indonesia
-
 Iran, Islamic republic
-
 Iraq
-
 Ireland
-
 Israel
-
 Italy
-
 Jamaica
-
 Japan
-
 Jordan
-
 Kazakhstan
-
 Kenya
-
 Korea
-
 Kuwait
-
 Kyrgyzstan
-
 Laos
-
 Latvia
-
 Lebanon
-
 Lesotho
-
 Libya
-
 Lithuania
-
 Luxembourg
-
 Madagascar
-
 Malaysia
-
 Malta
-
 Mauritius
-
 Mexico
-
 Moldova
-
 Mongolia
-
 Montenegro
-
 Morocco
-
 Mozambique
-
 Myanmar
-
 Namibia
-
 Nepal
-
 Netherlands
-
 New Zealand
-
 Nigeria
-
 North Macedonia
-
 Norway
-
 Oman
-
 Pakistan
-
 Palestine
-
 Panama
-
 Papua New Guinea
-
 Paraguay
-
 Peru
-
 Philippines
-
 Poland
-
 Portugal
-
 Puerto Rico
-
 Qatar
-
 Reunion
-
 Romania
-
 Rwanda
-
 Saudi Arabia
-
 Serbia
-
 Singapore
-
 Slovakia
-
 Slovenia
-
 Somalia
-
 South Africa
-
 Spain
-
 Sri Lanka
-
 Sweden
-
 Switzerland
-
 Syria
-
 Taiwan
-
 Tajikistan
-
 Tanzania
-
 Thailand
-
 Trinidad and Tobago
-
 Tunisia
-
 Turkey
-
 UAE
-
 Uganda
-
 Ukraine
-
 United Kingdom
-
United States
-
 Uruguay
-
 Uzbekistan
-
 Venezuela
-
 Vietnam
-
 Yemen
-
 Zambia
-
 Zimbabwe
- Forex
- Crypto












