

Downside momentum and technical signals drive S&P 500 lower by over 1%

S&P 500 Index (SPX) fell 1.26% after last week's resilient showing as short- and medium-term momentum shifted modestly negative. The decline is supported by the index trading below its MA-20 and MA-50, underscoring increased selling pressure in the near term despite a still-bullish long-term technical structure.
 7617.27
7649.65
Highlights
- The S&P 500 gained 3% last week, as U.S. large-cap stocks showed ongoing resilience and expectations for earnings growth remained firm.
- The equal-weighted S&P 500 outperformed the main index since early August with broad sector improvement and increased artificial intelligence adoption.
- Technical signals show persistent selling pressure with near-term resistance at 7,472 and support at 7,377, and a 75% probability of a downward move over the next five sessions.
Resilience contrasts with broad selling as sector rotation emerges
The S&P 500 recorded a 3% rally last week despite prevailing bearish sentiment, reflecting continued resilience among U.S. large-cap stocks. Analyst commentary noted the S&P 500 slightly declined since early August, while the equal-weighted index posted gains, highlighting changes in sector performance. Recent activity was accompanied by expectations for healthy earnings growth, lower oil prices, and stable interest rates, as well as increasing adoption of artificial intelligence across sectors, though price action has remained under broader selling pressure.
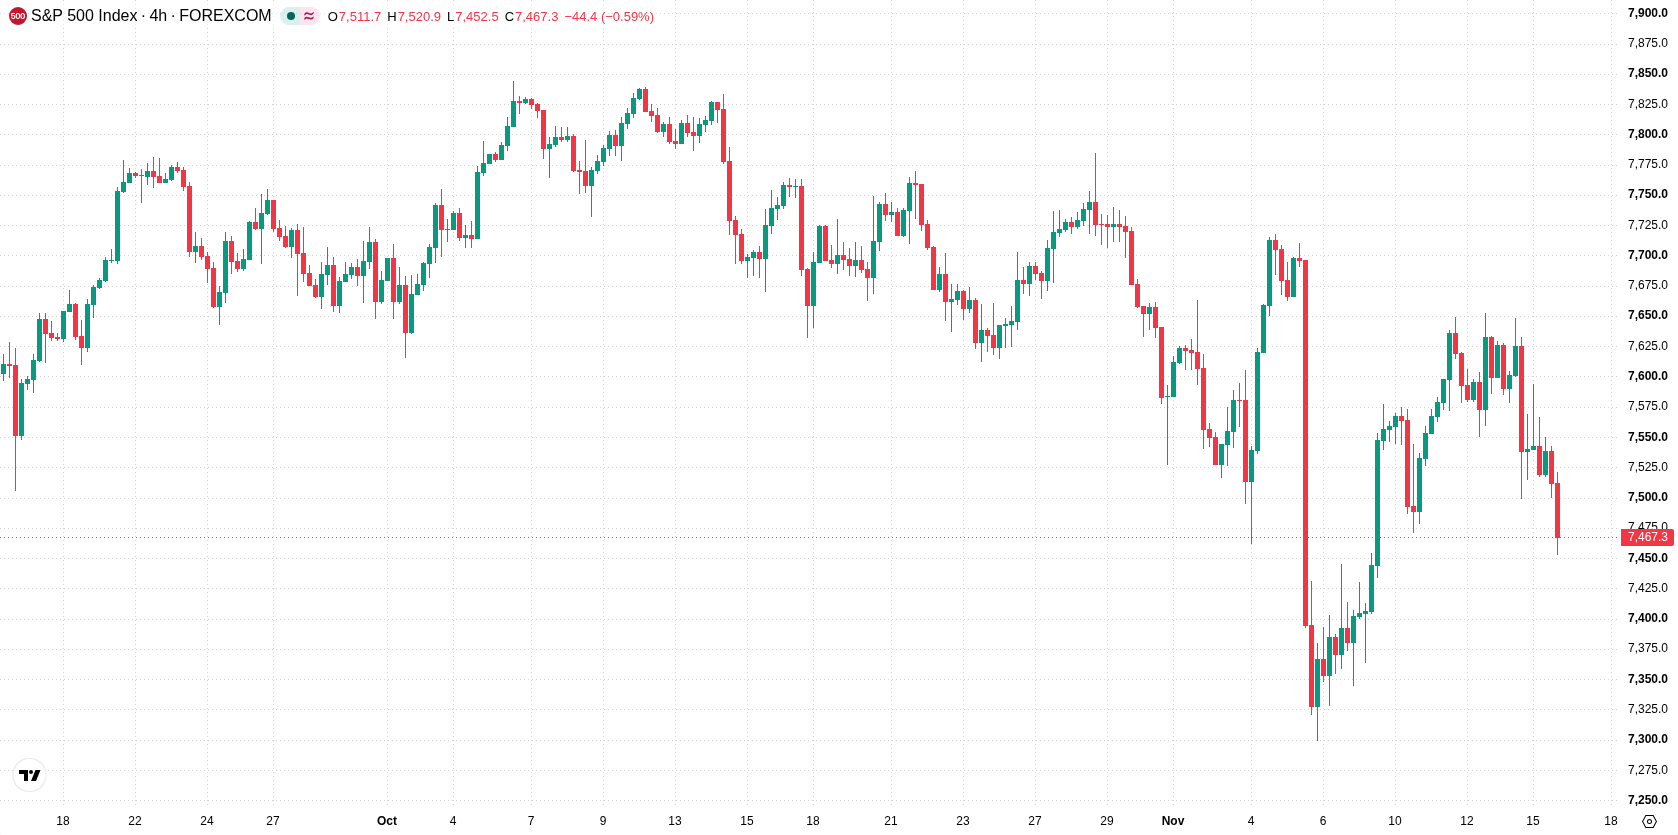
Downside pressure builds with negative momentum and weak trend
The S&P 500 is currently trading below the MA-20 at 7,612 and the MA-50 at 7,667, but remains above the MA-200 at 7,340. This setup points to ongoing near-term and medium-term downside momentum from sellers, while the long-term trend remains technically bullish given the MA-50 vs MA-200 alignment. Resistance is seen at 7,472, with immediate support at 7,377. Momentum signals remain negative, with the MACD showing a strong sell signal and a low-strength trend confirmed by the ADX. Oscillators, including RSI, Stochastic RSI, and CCI, are all neutral. The Bull/Bear Power is positive on an intraday basis, while the Awesome Oscillator is neutral and does not add to the prevailing move. The session saw a 1.26% drop to 7,466, with selling pressure dominating and volatility at 1.52%.
In a recent review, analysts highlighted the persistence of near-term bearish pressures on the S&P 500 despite longer-term support from major moving averages. The current analysis reinforces this view, with downside risks remaining elevated and a decisive break below 7,377 likely to herald further short-term declines.






Latest S&P 500 News





-
 Afghanistan
-
 Albania
-
 Algeria
-
 Angola
-
 Argentina
-
 Armenia
-
 Australia
-
 Austria
-
 Azerbaijan
-
 Bahamas
-
 Bahrain
-
 Bangladesh
-
 Belarus
-
 Belgium
-
 Bolivia
-
 Botswana
-
 Brazil
-
 Brunei
-
 Bulgaria
-
 Cambodia
-
 Cameroon
-
 Canada
-
 Chile
-
 China
-
 Colombia
-
 Congo
-
 Costa Rica
-
 Cote d'Ivoire
-
 Croatia
-
 Cuba
-
 Cyprus
-
 Czechia
-
 DR Congo
-
 Denmark
-
 Dominican Republic
-
 Ecuador
-
 Egypt
-
 El Salvador
-
 Estonia
-
 Eswatini
-
 Ethiopia
-
 Finland
-
 France
-
 Georgia
-
 Germany
-
 Ghana
-
 Greece
-
 Haiti
-
 Hong Kong
-
 Hungary
-
 India
-
 Indonesia
-
 Iran, Islamic republic
-
 Iraq
-
 Ireland
-
 Israel
-
 Italy
-
 Jamaica
-
 Japan
-
 Jordan
-
 Kazakhstan
-
 Kenya
-
 Korea
-
 Kuwait
-
 Kyrgyzstan
-
 Laos
-
 Latvia
-
 Lebanon
-
 Lesotho
-
 Libya
-
 Lithuania
-
 Luxembourg
-
 Madagascar
-
 Malaysia
-
 Malta
-
 Mauritius
-
 Mexico
-
 Moldova
-
 Mongolia
-
 Montenegro
-
 Morocco
-
 Mozambique
-
 Myanmar
-
 Namibia
-
 Nepal
-
 Netherlands
-
 New Zealand
-
 Nigeria
-
 North Macedonia
-
 Norway
-
 Oman
-
 Pakistan
-
 Palestine
-
 Panama
-
 Papua New Guinea
-
 Paraguay
-
 Peru
-
 Philippines
-
 Poland
-
 Portugal
-
 Puerto Rico
-
 Qatar
-
 Reunion
-
 Romania
-
 Rwanda
-
 Saudi Arabia
-
 Serbia
-
 Singapore
-
 Slovakia
-
 Slovenia
-
 Somalia
-
 South Africa
-
 Spain
-
 Sri Lanka
-
 Sweden
-
 Switzerland
-
 Syria
-
 Taiwan
-
 Tajikistan
-
 Tanzania
-
 Thailand
-
 Trinidad and Tobago
-
 Tunisia
-
 Turkey
-
 UAE
-
 Uganda
-
 Ukraine
-
 United Kingdom
-
United States
-
 Uruguay
-
 Uzbekistan
-
 Venezuela
-
 Vietnam
-
 Yemen
-
 Zambia
-
 Zimbabwe
- Forex
- Crypto












