
Meta struggles near $609 as EMA stack turns into heavy resistance block

Meta Platforms is struggling to stabilize after a steep multi-week breakdown pushed the stock back toward the $600–$620 support band that has anchored buyers for most of the year. Price trades near $609, but recent candles show hesitation rather than commitment, highlighting how quickly sentiment has deteriorated since early November’s earnings-driven reversal.
Highlights
- Meta trades near $609 as price retests the $600–$620 support shelf.
- The stock sits below all major EMAs, including the 20-day at $657 and 50-day at $694.
- RSI remains stuck near 30, signaling persistent downside momentum with no reversal trigger.
Meta’s long-term ascending trendline, active from April through October, was fully broken during the November decline. Since then, the stock has not managed a single close back above the line, confirming a transition from a steady uptrend to a pressured downtrend. The $600–$620 region is now the only significant demand zone left before price opens a deeper path toward the mid-$500s.
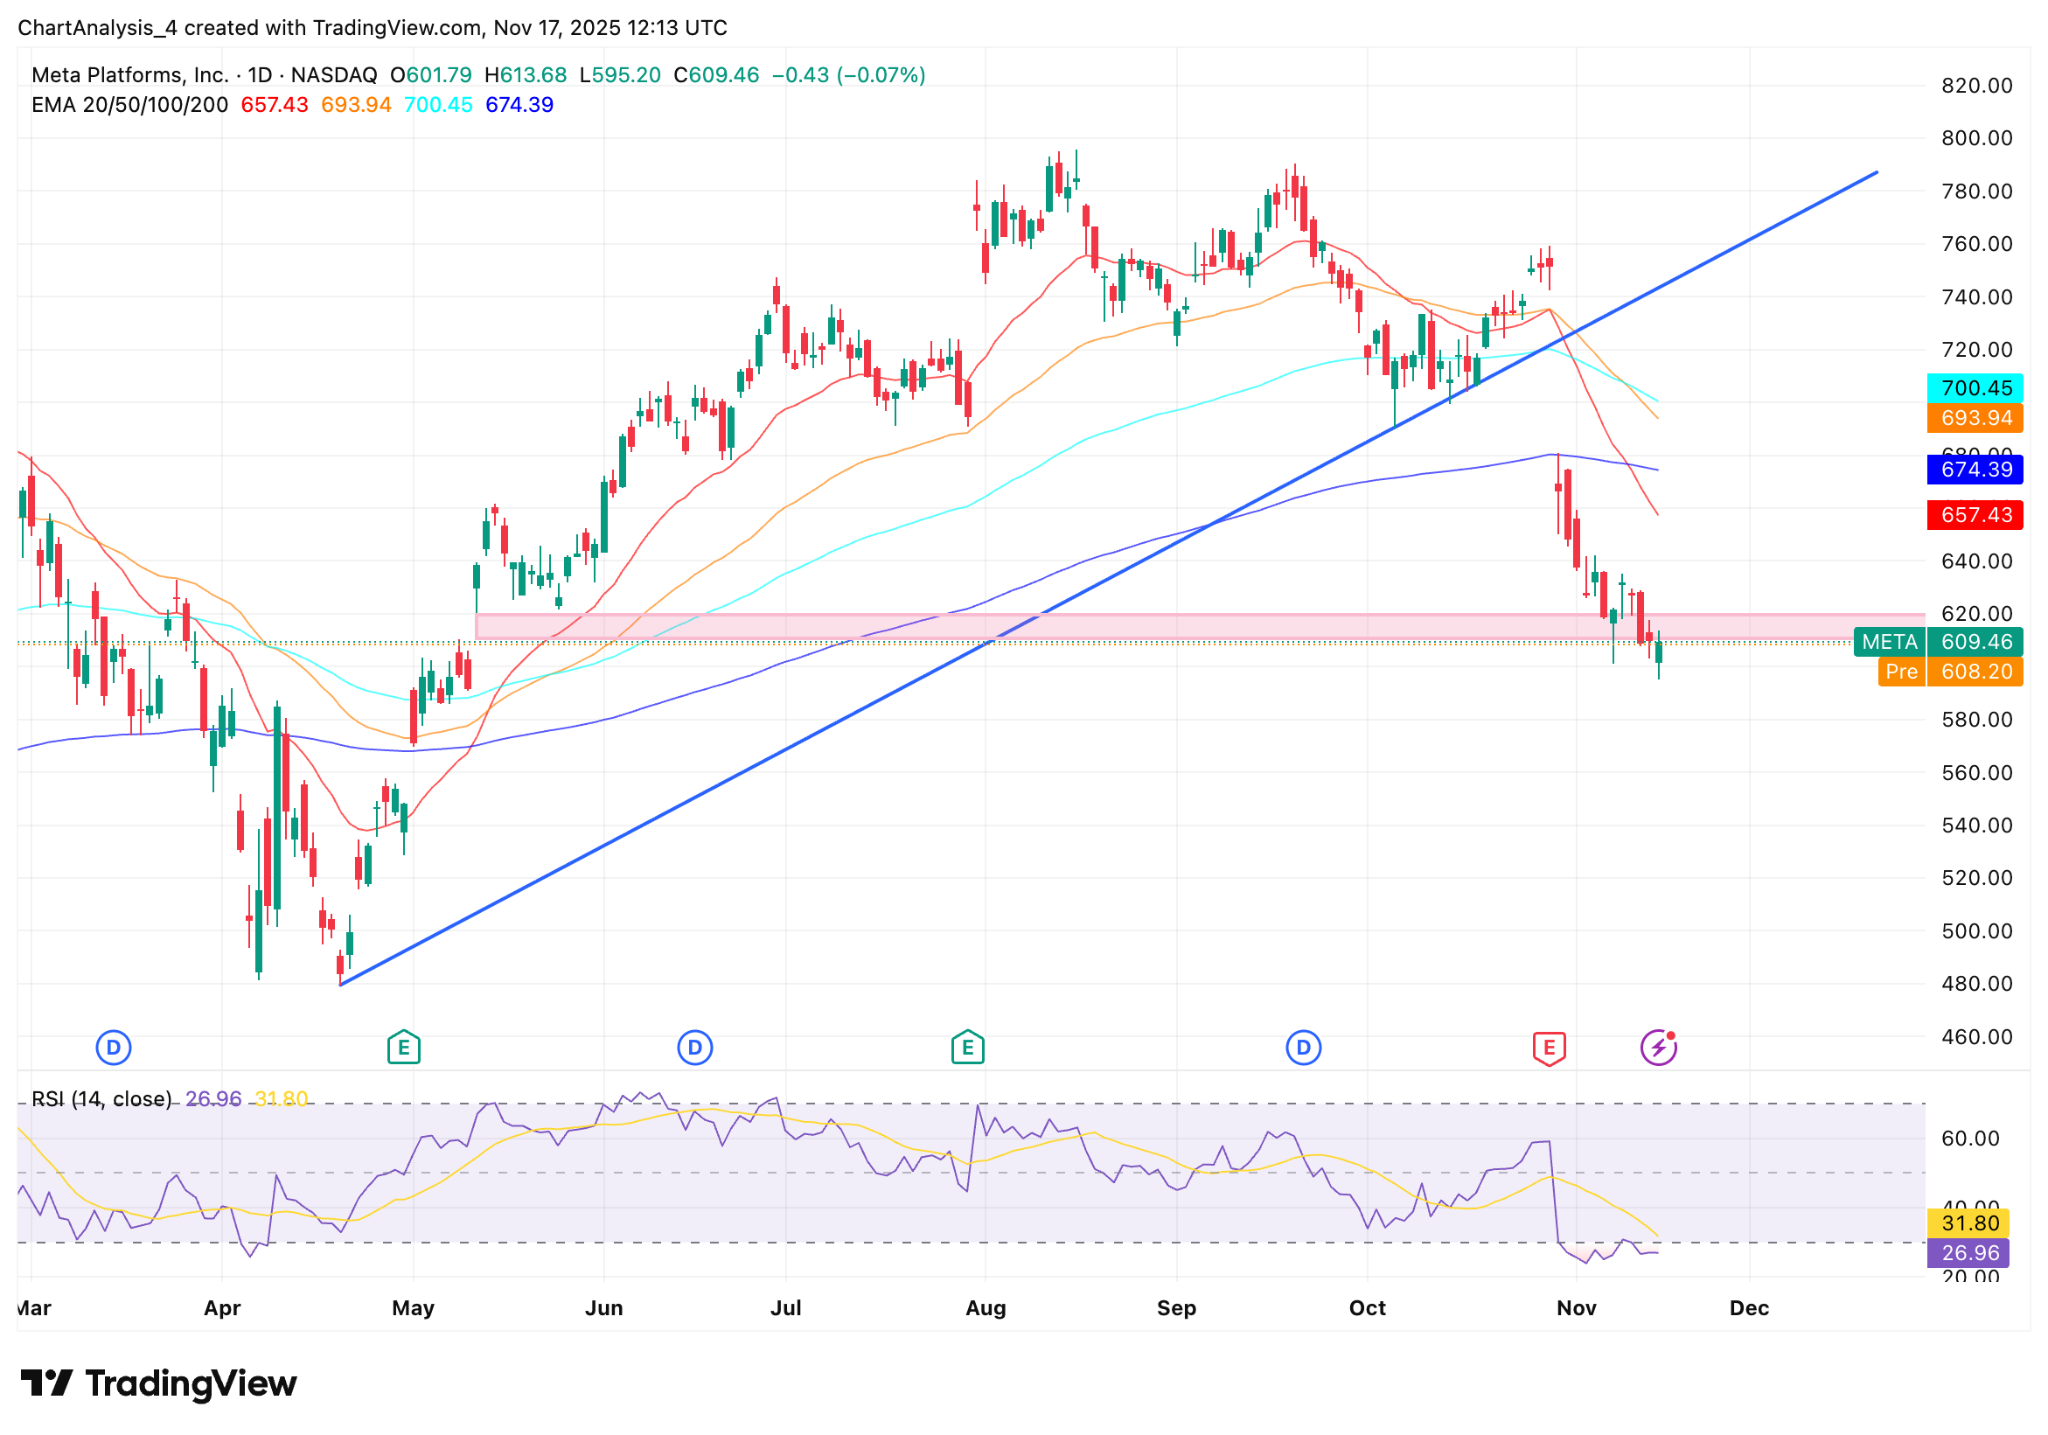
Meta stock price dynamics (Source: TradingView)
The moving averages reflect the shift clearly. Meta remains well below the 20-day EMA at $657, the 50-day at $694 and the 100-day at $700. This EMA stack has widened sharply above price, forming a heavy overhead block that sellers continue to defend aggressively. Every bounce over the past nine sessions has stalled well before the first moving average, underscoring the strength of near-term supply.
Momentum remains firmly bearish. The daily RSI sits between 27 and 32, reflecting heavy pressure and an extended oversold phase without meaningful response. The absence of bullish divergence indicates a market still dominated by sellers rather than early accumulation. This aligns with how each attempted rebound has faded almost immediately after forming.
Short-term charts reinforce the same narrative. On the 30-minute time frame, price continues to fail at the VWAP band, while the Supertrend indicator has remained red for two straight weeks. Even intraday rallies lack depth, fading below the same supply pockets that have contained price since the earnings reversal. Flow behavior has also stayed one-sided, with no indication of institutional demand returning.
Support holds for now, but momentum still favors the downside
The next pivot for Meta lies at the lower edge of the current support zone near $600. A break below this level would expose $580, followed by the deeper structural shelf at $560 that acted as a key pivot during previous consolidation phases. These areas represent the next liquidity pockets if sellers remain in control.
Any meaningful recovery requires Meta to reclaim the 20-day EMA at $657 and then break above the 50-day EMA at $694. Those levels carry the most technical weight, as they capped several rallies throughout October and have now turned into a major barrier. Without a clean reclaim of that EMA cluster, all upside attempts remain counter-trend and vulnerable to failure.
For now, Meta remains a downward-leaning chart. The stock is trading under broken trendline support, beneath all major moving averages and below intraday resistance bands, with no confirmed reversal signal on any timeframe. The path of least resistance stays to the downside unless buyers regain control above the 20-day EMA.
In earlier coverage, we noted that Meta’s breakdown below its April trendline marked the earliest phase of structural weakness in its year-long advance. Price action this week reinforces that view, with the stock now leaning heavily on the final support shelf at $600–$620 and momentum indicators still failing to show meaningful stabilization.


-
 Afghanistan
-
 Albania
-
 Algeria
-
 Angola
-
 Argentina
-
 Armenia
-
 Australia
-
 Austria
-
 Azerbaijan
-
 Bahamas
-
 Bahrain
-
 Bangladesh
-
 Belarus
-
 Belgium
-
 Bolivia
-
 Botswana
-
 Brazil
-
 Brunei
-
 Bulgaria
-
 Cambodia
-
 Cameroon
-
 Canada
-
 Chile
Chile
-
 China
China
-
 Colombia
-
 Congo
Congo
-
 Costa Rica
-
 Cote d'Ivoire
-
 Croatia
-
 Cuba
Cuba
-
 Cyprus
-
 Czechia
-
 DR Congo
-
 Denmark
-
 Dominican Republic
-
 Ecuador
-
 Egypt
Egypt
-
 El Salvador
-
 Estonia
-
 Eswatini
-
 Ethiopia
-
 Finland
-
 France
-
 Georgia
-
 Germany
-
 Ghana
Ghana
-
 Greece
-
 Haiti
Haiti
-
 Hong Kong
-
 Hungary
-
 India
India
-
 Indonesia
-
 Iran, Islamic republic
-
 Iraq
Iraq
-
 Ireland
-
 Israel
-
 Italy
Italy
-
 Jamaica
-
 Japan
Japan
-
 Jordan
-
 Kazakhstan
-
 Kenya
Kenya
-
 Korea
Korea
-
 Kuwait
-
 Kyrgyzstan
-
 Laos
Laos
-
 Latvia
-
 Lebanon
-
 Lesotho
-
 Libya
Libya
-
 Lithuania
-
 Luxembourg
-
 Madagascar
-
 Malaysia
-
 Malta
Malta
-
 Mauritius
-
 Mexico
-
 Moldova
-
 Mongolia
-
 Montenegro
-
 Morocco
-
 Mozambique
-
 Myanmar
-
 Namibia
-
 Nepal
Nepal
-
 Netherlands
-
 New Zealand
-
 Nigeria
-
 North Macedonia
-
 Norway
-
 Oman
Oman
-
 Pakistan
-
 Palestine
-
 Panama
-
 Papua New Guinea
-
 Paraguay
-
 Peru
Peru
-
 Philippines
-
 Poland
-
 Portugal
-
 Puerto Rico
-
 Qatar
Qatar
-
 Reunion
-
 Romania
-
 Rwanda
-
 Saudi Arabia
-
 Serbia
-
 Singapore
-
 Slovakia
-
 Slovenia
-
 Somalia
-
 South Africa
-
 Spain
Spain
-
 Sri Lanka
-
 Sweden
-
 Switzerland
-
 Syria
Syria
-
 Taiwan
-
 Tajikistan
-
 Tanzania
-
 Thailand
-
 Trinidad and Tobago
-
 Tunisia
-
 Turkey
-
 UAE
UAE
-
 Uganda
-
 Ukraine
-
 United Kingdom
-
United States
-
 Uruguay
-
 Uzbekistan
-
 Venezuela
-
 Vietnam
-
 Yemen
Yemen
-
 Zambia
-
 Zimbabwe
- Forex
- Crypto
