
Microsoft rebounds to $492 as governance pressure meets improving technical momentum

Microsoft shares attempted a stabilizing rebound, closing at $492 last week after carving out a short-term base between $470 and $475. The recovery arrives after a two-week slide that pushed the stock into deeply oversold territory heading into a consequential week marked by the December 5 annual general meeting and increased scrutiny from major shareholders.
Highlights
- Microsoft rises toward $492 after defending support at $470–$475.
- The Norway wealth fund backs a human-rights audit and plans to vote against Nadella as chair.
- RSI climbs above 51 as MSFT breaks its November downtrend for the first time in weeks.
The Norway wealth fund’s plan to vote for a human-rights risk report and against Satya Nadella’s dual role as CEO and board chair has added a layer of governance tension, yet the market appears focused on structural improvement rather than politics. The stock’s rebound signals that buyers are regaining confidence ahead of a heavy macro and corporate week. Despite governance headwinds, traders appear to be placing greater weight on technical positioning, valuation adjustment, and Microsoft’s broader AI-infrastructure narrative. With MSFT now pushing into its first major resistance cluster in nearly a month, the coming sessions will determine whether the reversal can extend.
Technical structure turns constructive after two-week decline
The 4-hour chart shows MSFT breaking above its descending trendline for the first time since early November. This move followed a clean rotation from the lower Fibonacci zone, where price bounced near the 0.236 retracement at $486.47. The rebound accelerated through $487–$489, placing the stock in direct contention with the multi-EMA cluster that has capped upside throughout November.
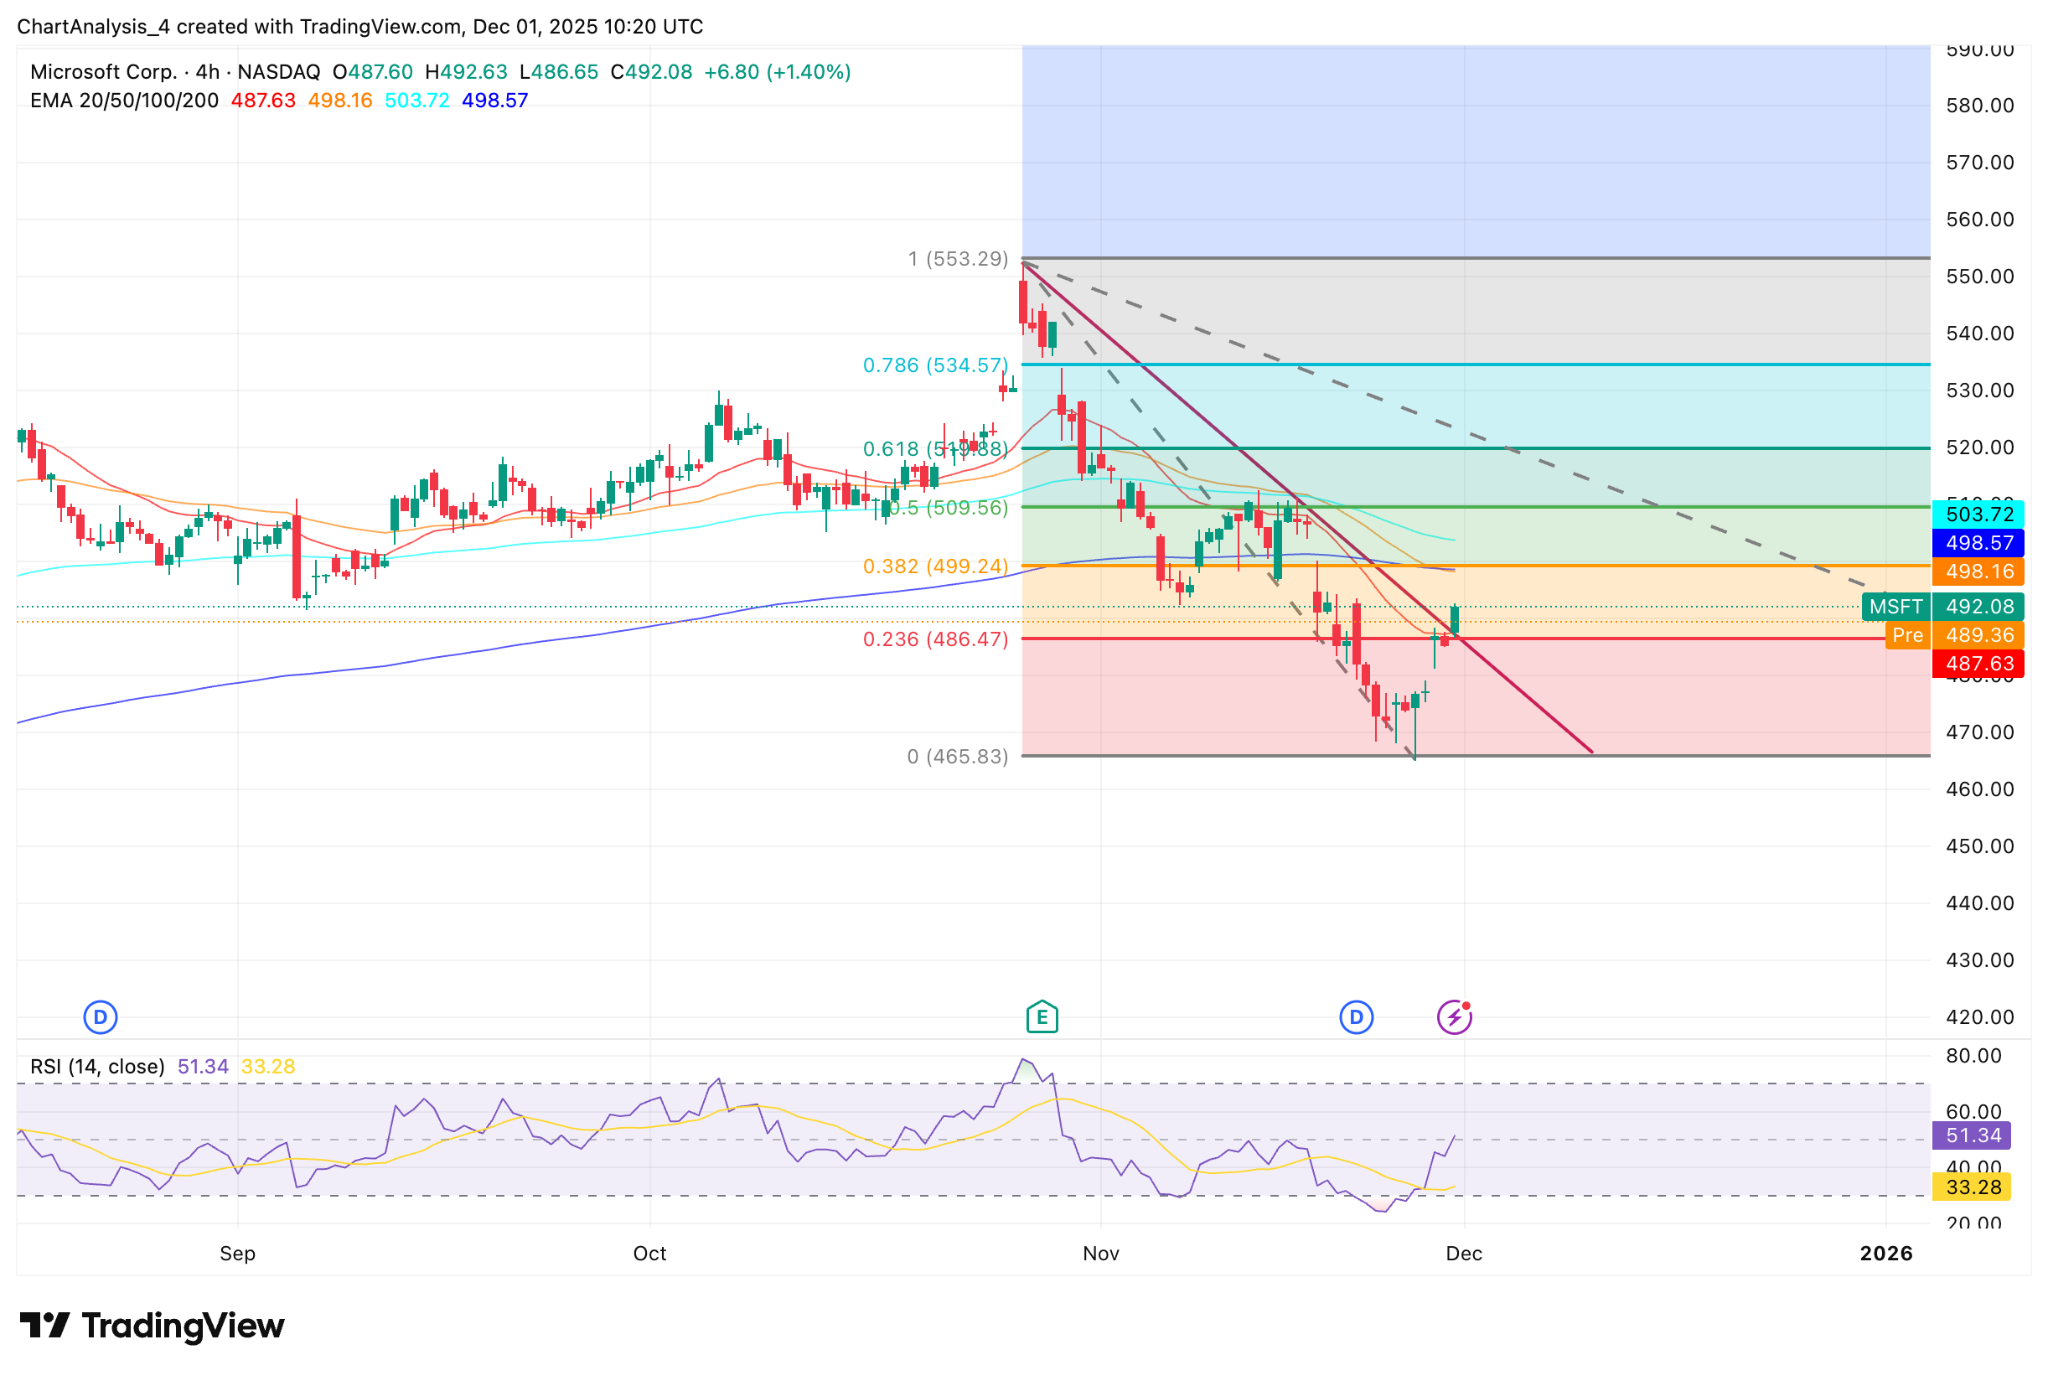
MSFT price dynamics (Source: TradingView)
The 20-EMA sits at $487.63, the 50-EMA at $498.16, the 100-EMA at $503.72, and the 200-EMA at $498.57. These levels converge with the 0.382 Fibonacci retracement at $499.24, making the $498–$503 range a decisive resistance band for the week. A breakout through this zone would flip the medium-term structure and open the path toward the 0.618 retracement at $514.18, followed by the 0.786 level at $534.57 — an area that aligns with the supply zone formed during September and October consolidation.
Momentum has begun to confirm the shift. RSI has risen from sub-33 readings to above 51, marking the first bullish turn since mid-November. The pattern of red candles dominating price action has faded, replaced by a clear sequence of higher lows as buyers absorb supply more aggressively. If MSFT can sustain RSI above 50 through the AGM, it would signal that dips are likely to be defended even if newsflow introduces short-term volatility.
Governance pressure builds ahead of AGM
Fundamental developments this week are unusually intertwined with technical behavior. The Norway wealth fund — a $2 trillion institution and one of Microsoft’s most influential shareholders — announced its support for a proposal requiring a human-rights risk audit. The fund also intends to vote against Nadella’s reappointment as board chair and against his compensation package. These positions reflect broader debates about governance, accountability, and leadership structure across major tech firms.
While the votes are unlikely to reshape Microsoft’s operational strategy immediately, they add a layer of uncertainty that markets typically price via cautious positioning. Yet Microsoft’s ability to rebound ahead of the AGM suggests traders believe the stock’s AI-infrastructure expansion and long-term earnings profile outweigh the governance noise.
The broader tech sector’s stabilization has also provided support. Investors are reassessing valuation pressures following the recent correction, and MSFT — a bellwether for enterprise AI and cloud adoption — appears to be attracting early rotational flows as markets prepare for year-end positioning.
Path forward depends on EMA cluster
If bulls can reclaim the $498–$503 ceiling, the market would gain confidence in a broader recovery toward $514 and $534, levels that align with deeper Fibonacci retracements and prior consolidation zones. This scenario would also reestablish Microsoft’s alignment with its long-term uptrend channel, effectively invalidating the November downtrend.
Failure to clear this band, however, could force a retest of $486, followed by structural support at $470 — the level separating a bullish recovery attempt from renewed downside. A break below $465 would confirm a deeper correction targeting the mid-$450s.For now, buyers have regained short-term control, volume has improved, and the stock is advancing into resistance with its strongest momentum in weeks.
Previously, we highlighted Microsoft’s vulnerability around the $470 region and noted that a rebound would require a break above the descending trendline and EMA cluster. The latest move toward $492 confirms the first leg of that shift, with the stock now testing the critical ceiling that will determine whether a sustained recovery can unfold.


Latest Microsoft News


-
 Afghanistan
-
 Albania
-
 Algeria
-
 Angola
-
 Argentina
-
 Armenia
-
 Australia
-
 Austria
-
 Azerbaijan
-
 Bahamas
-
 Bahrain
-
 Bangladesh
-
 Belarus
-
 Belgium
-
 Bolivia
-
 Botswana
-
 Brazil
-
 Brunei
-
 Bulgaria
-
 Cambodia
-
 Cameroon
-
 Canada
-
 Chile
Chile
-
 China
China
-
 Colombia
-
 Congo
Congo
-
 Costa Rica
-
 Cote d'Ivoire
-
 Croatia
-
 Cuba
Cuba
-
 Cyprus
-
 Czechia
-
 DR Congo
-
 Denmark
-
 Dominican Republic
-
 Ecuador
-
 Egypt
Egypt
-
 El Salvador
-
 Estonia
-
 Eswatini
-
 Ethiopia
-
 Finland
-
 France
-
 Georgia
-
 Germany
-
 Ghana
Ghana
-
 Greece
-
 Haiti
Haiti
-
 Hong Kong
-
 Hungary
-
 India
India
-
 Indonesia
-
 Iran, Islamic republic
-
 Iraq
Iraq
-
 Ireland
-
 Israel
-
 Italy
Italy
-
 Jamaica
-
 Japan
Japan
-
 Jordan
-
 Kazakhstan
-
 Kenya
Kenya
-
 Korea
Korea
-
 Kuwait
-
 Kyrgyzstan
-
 Laos
Laos
-
 Latvia
-
 Lebanon
-
 Lesotho
-
 Libya
Libya
-
 Lithuania
-
 Luxembourg
-
 Madagascar
-
 Malaysia
-
 Malta
Malta
-
 Mauritius
-
 Mexico
-
 Moldova
-
 Mongolia
-
 Montenegro
-
 Morocco
-
 Mozambique
-
 Myanmar
-
 Namibia
-
 Nepal
Nepal
-
 Netherlands
-
 New Zealand
-
 Nigeria
-
 North Macedonia
-
 Norway
-
 Oman
Oman
-
 Pakistan
-
 Palestine
-
 Panama
-
 Papua New Guinea
-
 Paraguay
-
 Peru
Peru
-
 Philippines
-
 Poland
-
 Portugal
-
 Puerto Rico
-
 Qatar
Qatar
-
 Reunion
-
 Romania
-
 Rwanda
-
 Saudi Arabia
-
 Serbia
-
 Singapore
-
 Slovakia
-
 Slovenia
-
 Somalia
-
 South Africa
-
 Spain
Spain
-
 Sri Lanka
-
 Sweden
-
 Switzerland
-
 Syria
Syria
-
 Taiwan
-
 Tajikistan
-
 Tanzania
-
 Thailand
-
 Trinidad and Tobago
-
 Tunisia
-
 Turkey
-
 UAE
UAE
-
 Uganda
-
 Ukraine
-
 United Kingdom
-
United States
-
 Uruguay
-
 Uzbekistan
-
 Venezuela
-
 Vietnam
-
 Yemen
Yemen
-
 Zambia
-
 Zimbabwe
- Forex
- Crypto
