
Sellers control the short-term trend. Can Alphabet stock avoid deeper losses?

Alphabet (GOOGL) stock is trading at $357.23 after a modest move lower today, with price trending near the top of its daily range. The stock is currently positioned above its key short-term averages but remains beneath its intermediate benchmarks, reflecting mixed short- and medium-term signals.
 356.67
373.16
356.67
373.16
Highlights
- GOOGL/USD trades above short-term averages but faces medium-term selling pressure, supporting a rangebound outlook.
- Oscillators signal overbought conditions and weak momentum, creating uncertainty despite intraday buyer dominance.
- Price likely consolidates between $347.36 and $367.10 over the next 2-3 days, with a downside bias of 55%.
Sell momentum dominates as resistance holds against overbought signals
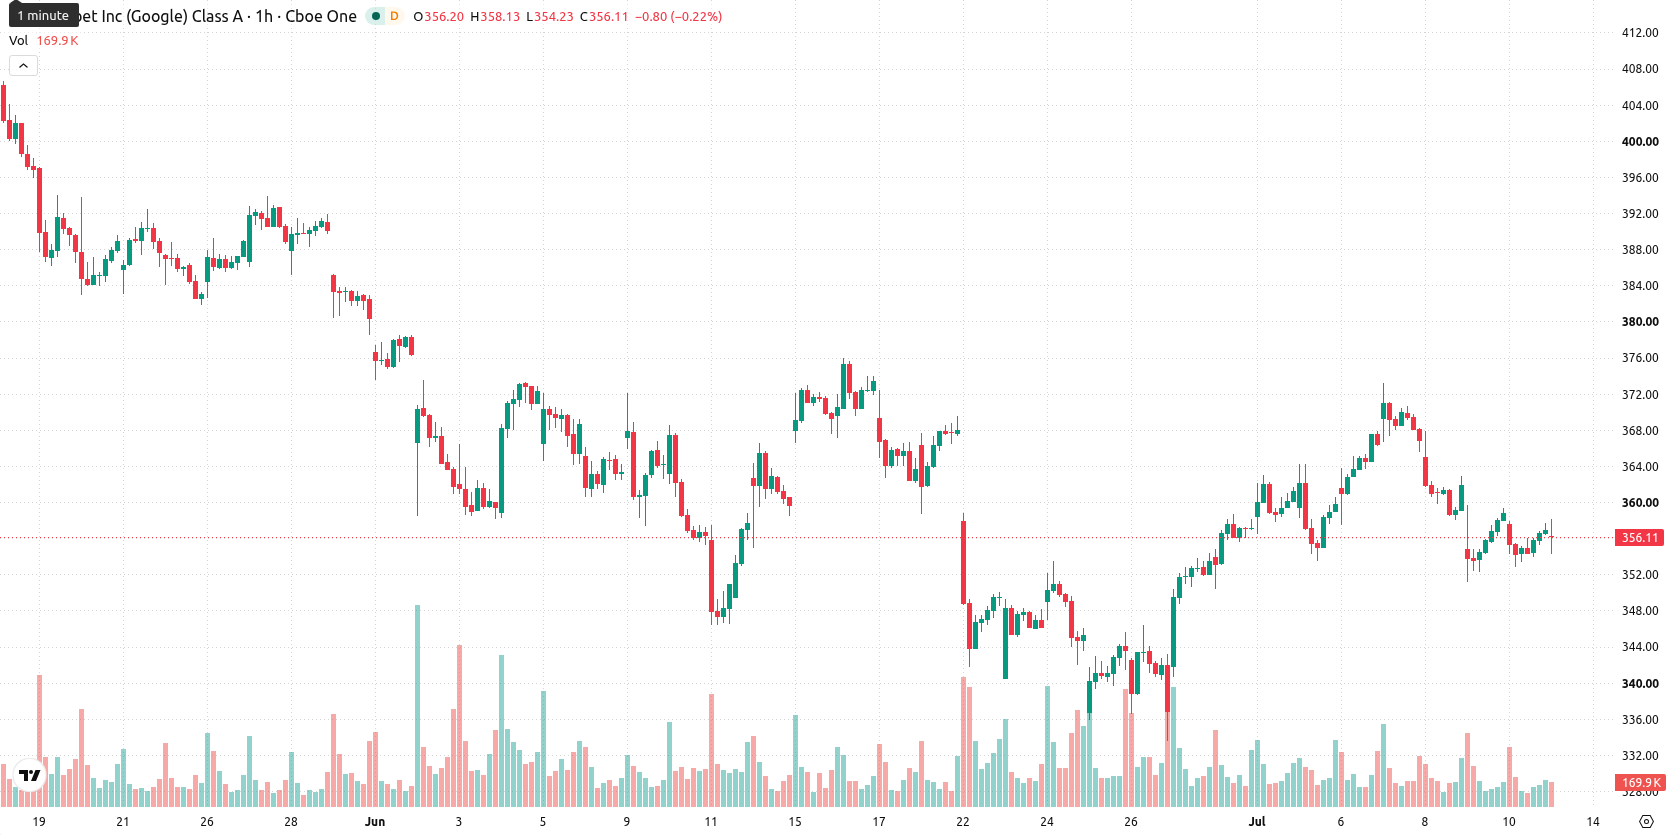
On the hourly chart, GOOGL has established support above the 20-period moving average, while resistance persists at the 50-period moving average. The daily timeframe shows price continuing above the 200-period moving average, while the Ichimoku Kijun sits at $360.87 and establishes a key resistance level. The Moving Average Convergence Divergence (MACD) indicates strong sell momentum, and the Average Directional Index (ADX) is neutral, reflecting uncertain trend strength. The Relative Strength Index (RSI) reads 47.48, aligning with a sell bias, while the Stochastic RSI is overbought, suggesting current price elevation despite broader selling signals. Commodity Channel Index (CCI) and the Awesome Oscillator are both neutral, whereas Bull/Bear Power highlights overbought intraday conditions.
Consolidation likely as probabilities tilt towards downside breakout
For the next two to three trading days, GOOGL is projected to move within a volatility band between $347.36 and $367.10. There is a 45% probability of an upside move and a 55% probability for further downside. The base case envisages price consolidation sideways inside this range. A breakout above $360.87 would set the stage for renewed upward momentum, while a move below support at $347.36 could bring additional risk to the downside.
Earlier, analysts noted that Alphabet’s ongoing AI expansion and strong cloud performance had reinforced its competitive standing and investor confidence. In the current environment, with mixed technical signals and heightened volatility, traders should closely monitor the $360.87 resistance, as a decisive move above this level could provide the next catalyst for sustained upside momentum.









-
 Afghanistan
-
 Albania
-
 Algeria
-
 Angola
-
 Argentina
-
 Armenia
-
 Australia
-
 Austria
-
 Azerbaijan
-
 Bahamas
-
 Bahrain
-
 Bangladesh
-
 Belarus
-
 Belgium
-
 Bolivia
-
 Botswana
-
 Brazil
-
 Brunei
-
 Bulgaria
-
 Cambodia
-
 Cameroon
-
 Canada
-
 Chile
Chile
-
 China
China
-
 Colombia
-
 Congo
Congo
-
 Costa Rica
-
 Cote d'Ivoire
-
 Croatia
-
 Cuba
Cuba
-
 Cyprus
-
 Czechia
-
 DR Congo
-
 Denmark
-
 Dominican Republic
-
 Ecuador
-
 Egypt
Egypt
-
 El Salvador
-
 Estonia
-
 Eswatini
-
 Ethiopia
-
 Finland
-
 France
-
 Georgia
-
 Germany
-
 Ghana
Ghana
-
 Greece
-
 Haiti
Haiti
-
 Hong Kong
-
 Hungary
-
 India
India
-
 Indonesia
-
 Iran, Islamic republic
-
 Iraq
Iraq
-
 Ireland
-
 Israel
-
 Italy
Italy
-
 Jamaica
-
 Japan
Japan
-
 Jordan
-
 Kazakhstan
-
 Kenya
Kenya
-
 Korea
Korea
-
 Kuwait
-
 Kyrgyzstan
-
 Laos
Laos
-
 Latvia
-
 Lebanon
-
 Lesotho
-
 Libya
Libya
-
 Lithuania
-
 Luxembourg
-
 Madagascar
-
 Malaysia
-
 Malta
Malta
-
 Mauritius
-
 Mexico
-
 Moldova
-
 Mongolia
-
 Montenegro
-
 Morocco
-
 Mozambique
-
 Myanmar
-
 Namibia
-
 Nepal
Nepal
-
 Netherlands
-
 New Zealand
-
 Nigeria
-
 North Macedonia
-
 Norway
-
 Oman
Oman
-
 Pakistan
-
 Palestine
-
 Panama
-
 Papua New Guinea
-
 Paraguay
-
 Peru
Peru
-
 Philippines
-
 Poland
-
 Portugal
-
 Puerto Rico
-
 Qatar
Qatar
-
 Reunion
-
 Romania
-
 Rwanda
-
 Saudi Arabia
-
 Serbia
-
 Singapore
-
 Slovakia
-
 Slovenia
-
 Somalia
-
 South Africa
-
 Spain
Spain
-
 Sri Lanka
-
 Sweden
-
 Switzerland
-
 Syria
Syria
-
 Taiwan
-
 Tajikistan
-
 Tanzania
-
 Thailand
-
 Trinidad and Tobago
-
 Tunisia
-
 Turkey
-
 UAE
UAE
-
 Uganda
-
 Ukraine
-
 United Kingdom
-
United States
-
 Uruguay
-
 Uzbekistan
-
 Venezuela
-
 Vietnam
-
 Yemen
Yemen
-
 Zambia
-
 Zimbabwe
- Forex
- Crypto











