
Alphabet shares technical analysis: Consolidation near $334.31 resistance

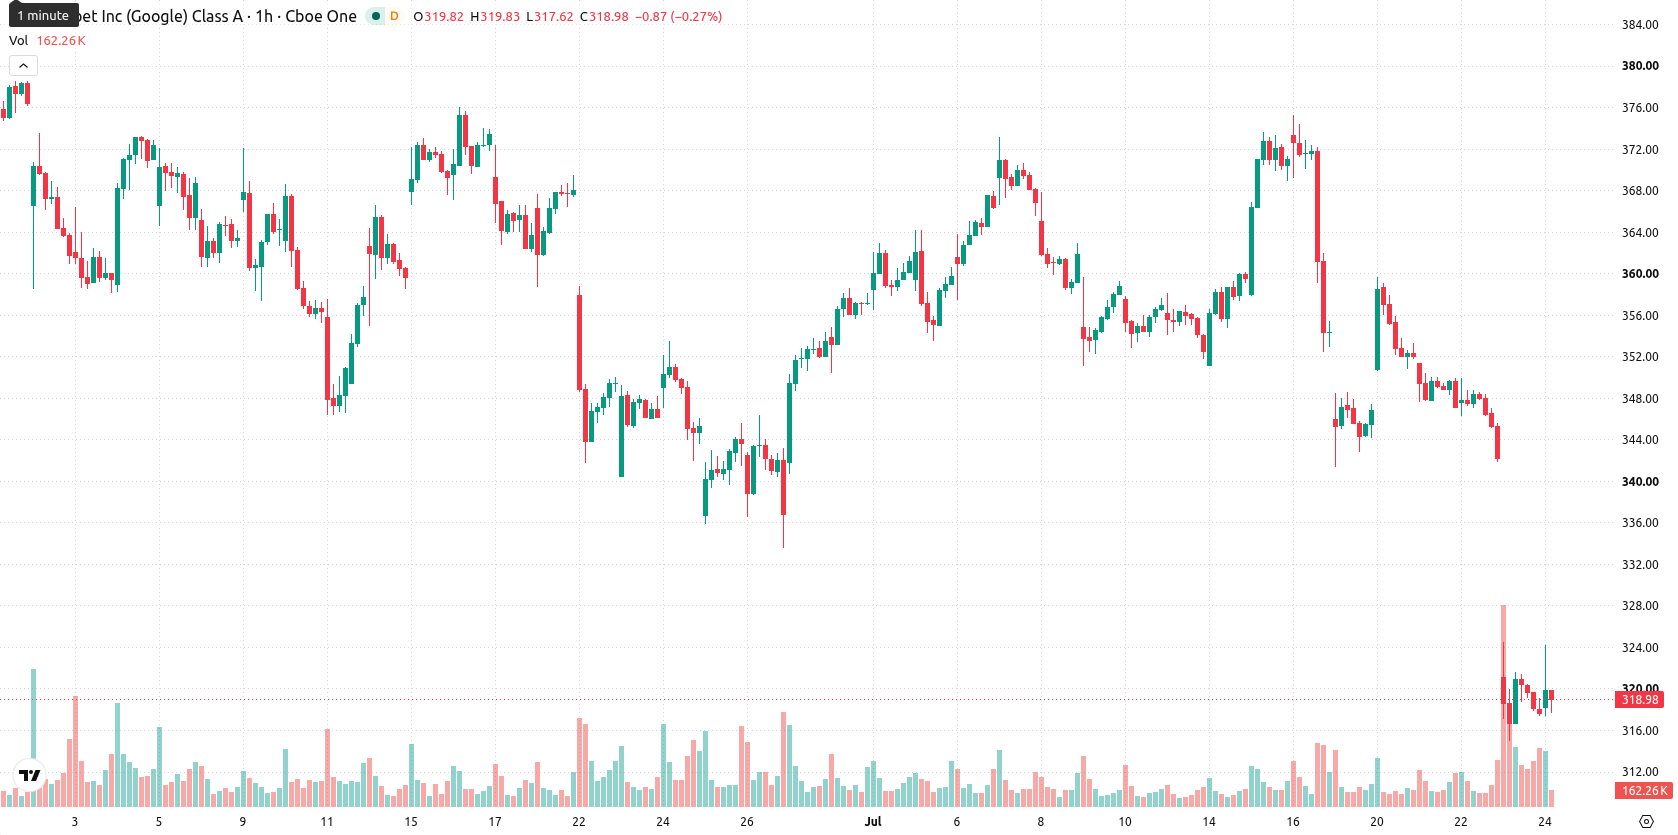
Alphabet (GOOGL) stock is trading at $318.72 with only a marginal uptick for the session. The stock remains below its key moving averages, indicating muted activity and low volatility within the current session range.
 328.00
349.94
328.00
349.94
Highlights
- Alphabet posted 24% year-over-year revenue growth to $119.8 billion, driven by Google Cloud’s rapid 82% expansion.
- Increased 2026 AI infrastructure spending guidance to $205 billion and a $1 billion EU fine created negative free cash flow, halting share buybacks.
- GOOGL trades below key technical averages with a 70% probability of further decline toward a $298.75–$338.69 near-term range.
AI spending, regulatory fines, and buyback halt raise volatility risk
Alphabet reported a 24% year-over-year increase in Q2 revenue to $119.8 billion, supported by rapid expansion in Google Cloud which grew 82%, according to Tipranks. However, the company raised its 2026 outlook for AI infrastructure capital expenditures to as much as $205 billion, resulting in negative free cash flow for the quarter and ending a long-running share buyback streak, as noted by Tipranks and Benzinga. While strong topline growth and accelerated enterprise adoption underscore Alphabet's fundamental strength, the impact of heavy AI investment and a $1 billion EU regulatory fine (Tradingkey) introduce volatility and place near-term pressures on liquidity and shareholder returns.
Technical weakness persists as multiple sell signals dominate
GOOGL trades below its MA-20 at $335.64 and MA-50 at $348.63 on the hourly chart, with sustained weakness under the daily MA-200 at $323.54. Immediate resistance sits at the Ichimoku Kijun level of $334.31. On the indicator front, both MACD and ADX register intraday sell signals, while RSI is deeply oversold at 22.76. Stochastic RSI suggests potential for a short-term bounce; however, CCI and Bull/Bear Power continue to reflect seller dominance, and the Awesome Oscillator offers a neutral stance.
Downside bias prevails amid defined volatility band
Over the coming sessions, GOOGL is likely to trade within a $298.75 to $338.69 volatility band relative to current levels. There is a 30% probability of an upward move, with a 70% likelihood of a downward break prevailing. Baseline expectations point to sideways price action as the stock searches for direction. A move above $334.31 may trigger a short-term recovery toward the upper end of the forecast range, while a break below $298.75 would likely reinforce selling pressure and open the door to new local lows.
In a recent review, analysts highlighted that Alphabet's long-term strength was counterbalanced by near-term downside risks stemming from heavy AI investment and escalating regulatory pressures. With the stock now entrenched below its key moving averages and technicals favoring sellers, traders should monitor for a decisive move through either $334.31 or $298.75 as signals for the next directional breakout.








-
 Afghanistan
-
 Albania
-
 Algeria
-
 Angola
-
 Argentina
-
 Armenia
-
 Australia
-
 Austria
-
 Azerbaijan
-
 Bahamas
-
 Bahrain
-
 Bangladesh
-
 Belarus
-
 Belgium
-
 Bolivia
-
 Botswana
-
 Brazil
-
 Brunei
-
 Bulgaria
-
 Cambodia
-
 Cameroon
-
 Canada
-
 Chile
Chile
-
 China
China
-
 Colombia
-
 Congo
Congo
-
 Costa Rica
-
 Cote d'Ivoire
-
 Croatia
-
 Cuba
Cuba
-
 Cyprus
-
 Czechia
-
 DR Congo
-
 Denmark
-
 Dominican Republic
-
 Ecuador
-
 Egypt
Egypt
-
 El Salvador
-
 Estonia
-
 Eswatini
-
 Ethiopia
-
 Finland
-
 France
-
 Georgia
-
 Germany
-
 Ghana
Ghana
-
 Greece
-
 Haiti
Haiti
-
 Hong Kong
-
 Hungary
-
 India
India
-
 Indonesia
-
 Iran, Islamic republic
-
 Iraq
Iraq
-
 Ireland
-
 Israel
-
 Italy
Italy
-
 Jamaica
-
 Japan
Japan
-
 Jordan
-
 Kazakhstan
-
 Kenya
Kenya
-
 Korea
Korea
-
 Kuwait
-
 Kyrgyzstan
-
 Laos
Laos
-
 Latvia
-
 Lebanon
-
 Lesotho
-
 Libya
Libya
-
 Lithuania
-
 Luxembourg
-
 Madagascar
-
 Malaysia
-
 Malta
Malta
-
 Mauritius
-
 Mexico
-
 Moldova
-
 Mongolia
-
 Montenegro
-
 Morocco
-
 Mozambique
-
 Myanmar
-
 Namibia
-
 Nepal
Nepal
-
 Netherlands
-
 New Zealand
-
 Nigeria
-
 North Macedonia
-
 Norway
-
 Oman
Oman
-
 Pakistan
-
 Palestine
-
 Panama
-
 Papua New Guinea
-
 Paraguay
-
 Peru
Peru
-
 Philippines
-
 Poland
-
 Portugal
-
 Puerto Rico
-
 Qatar
Qatar
-
 Reunion
-
 Romania
-
 Rwanda
-
 Saudi Arabia
-
 Serbia
-
 Singapore
-
 Slovakia
-
 Slovenia
-
 Somalia
-
 South Africa
-
 Spain
Spain
-
 Sri Lanka
-
 Sweden
-
 Switzerland
-
 Syria
Syria
-
 Taiwan
-
 Tajikistan
-
 Tanzania
-
 Thailand
-
 Trinidad and Tobago
-
 Tunisia
-
 Turkey
-
 UAE
UAE
-
 Uganda
-
 Ukraine
-
 United Kingdom
-
United States
-
 Uruguay
-
 Uzbekistan
-
 Venezuela
-
 Vietnam
-
 Yemen
Yemen
-
 Zambia
-
 Zimbabwe
- Forex
- Crypto












