
Hut 8 stock breaks below $109.74 support as weak momentum returns

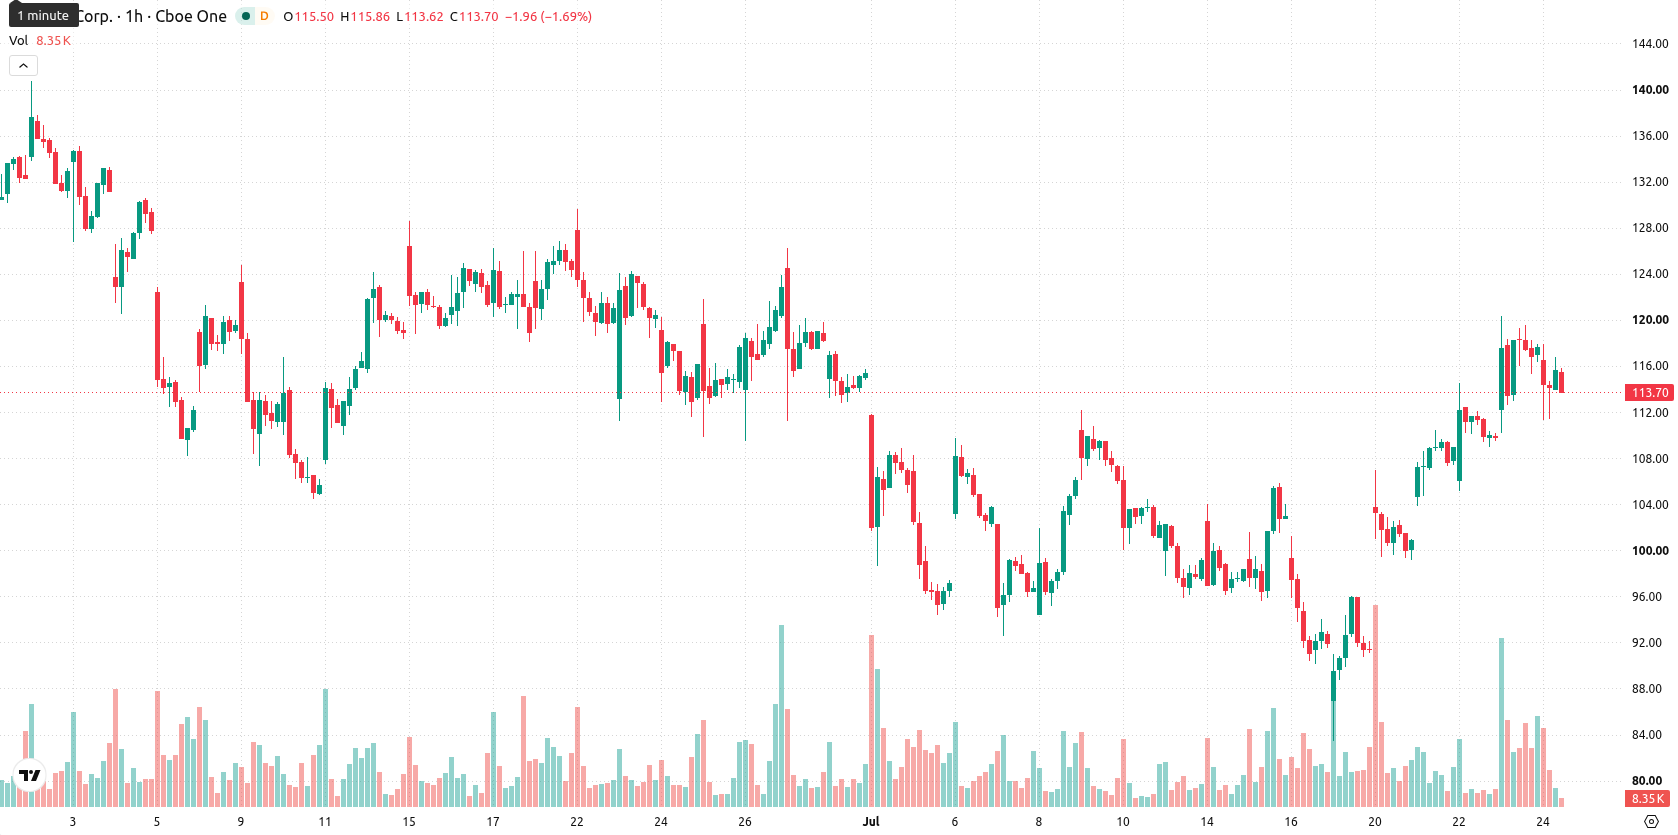
Hut 8 (HUT) stock is trading at $114.54, posting a daily decline of 2.66%. The price remains above its key moving averages, indicating continued strength relative to short- and medium-term trend levels.
 117.75
120.38
117.75
120.38
Highlights
- HUT/USD maintains a bullish structure with price action above key short- and long-term moving averages across all timeframes.
- Momentum signals are mixed—MACD and ADX support sustained buying, but oscillator divergences temper near-term conviction.
- Price is forecast to consolidate in the $105.02–$124.06 range over 2–3 days, with a 75% probability of upside.
Diverging signals as bullish momentum meets volatile indicators
On the technical front, HUT is currently trading above the MA-20 at $113.5 and the MA-50 at $104.63 on the hourly chart, and remains above the long-term MA-200 at $68.27 on the daily. The Ichimoku Kijun on the daily sits at $109.74, marking immediate support. Among momentum indicators, MACD signals a strong buy while ADX confirms active buying momentum. RSI is at 60.05, with CCI also bullish; however, Stoch RSI is in oversold territory. Bull/Bear Power is overbought intraday, indicating dominant buying activity, and the Awesome Oscillator remains neutral, not confirming the prevailing trend. Together, these indicator readings reveal diverging signals and highlight near-term uncertainty amid elevated volatility.
Short-term consolidation expected as upward bias prevails
Looking ahead to the next 2–3 trading days, HUT is expected to consolidate within a volatility band of $105.02 to $124.06. The probability of an upward scenario is high at 75%, with a 25% chance of downward extension. Should HUT break above short-term resistance, a test of the upper range is likely, while a failure of the $109.74 support may open the path to the lower boundary.
Previously it was reported that Hut 8's robust commercial momentum and bullish technical posture positioned the stock for further upside potential. The current divergence among technical indicators and intraday overbought signals points to a period of heightened volatility, making the $109.74 support level critical for traders monitoring potential shifts in direction.









-
 Afghanistan
-
 Albania
-
 Algeria
-
 Angola
-
 Argentina
-
 Armenia
-
 Australia
-
 Austria
-
 Azerbaijan
-
 Bahamas
-
 Bahrain
-
 Bangladesh
-
 Belarus
-
 Belgium
-
 Bolivia
-
 Botswana
-
 Brazil
-
 Brunei
-
 Bulgaria
-
 Cambodia
-
 Cameroon
-
 Canada
-
 Chile
Chile
-
 China
China
-
 Colombia
-
 Congo
Congo
-
 Costa Rica
-
 Cote d'Ivoire
-
 Croatia
-
 Cuba
Cuba
-
 Cyprus
-
 Czechia
-
 DR Congo
-
 Denmark
-
 Dominican Republic
-
 Ecuador
-
 Egypt
Egypt
-
 El Salvador
-
 Estonia
-
 Eswatini
-
 Ethiopia
-
 Finland
-
 France
-
 Georgia
-
 Germany
-
 Ghana
Ghana
-
 Greece
-
 Haiti
Haiti
-
 Hong Kong
-
 Hungary
-
 India
India
-
 Indonesia
-
 Iran, Islamic republic
-
 Iraq
Iraq
-
 Ireland
-
 Israel
-
 Italy
Italy
-
 Jamaica
-
 Japan
Japan
-
 Jordan
-
 Kazakhstan
-
 Kenya
Kenya
-
 Korea
Korea
-
 Kuwait
-
 Kyrgyzstan
-
 Laos
Laos
-
 Latvia
-
 Lebanon
-
 Lesotho
-
 Libya
Libya
-
 Lithuania
-
 Luxembourg
-
 Madagascar
-
 Malaysia
-
 Malta
Malta
-
 Mauritius
-
 Mexico
-
 Moldova
-
 Mongolia
-
 Montenegro
-
 Morocco
-
 Mozambique
-
 Myanmar
-
 Namibia
-
 Nepal
Nepal
-
 Netherlands
-
 New Zealand
-
 Nigeria
-
 North Macedonia
-
 Norway
-
 Oman
Oman
-
 Pakistan
-
 Palestine
-
 Panama
-
 Papua New Guinea
-
 Paraguay
-
 Peru
Peru
-
 Philippines
-
 Poland
-
 Portugal
-
 Puerto Rico
-
 Qatar
Qatar
-
 Reunion
-
 Romania
-
 Rwanda
-
 Saudi Arabia
-
 Serbia
-
 Singapore
-
 Slovakia
-
 Slovenia
-
 Somalia
-
 South Africa
-
 Spain
Spain
-
 Sri Lanka
-
 Sweden
-
 Switzerland
-
 Syria
Syria
-
 Taiwan
-
 Tajikistan
-
 Tanzania
-
 Thailand
-
 Trinidad and Tobago
-
 Tunisia
-
 Turkey
-
 UAE
UAE
-
 Uganda
-
 Ukraine
-
 United Kingdom
-
United States
-
 Uruguay
-
 Uzbekistan
-
 Venezuela
-
 Vietnam
-
 Yemen
Yemen
-
 Zambia
-
 Zimbabwe
- Forex
- Crypto












