

McDonald's stock consolidation risk rises as volatility climbs and upside momentum peaks: weekly analysis

Shares of McDonald's Corporation (MCD) are trading near $278 following a rally of more than 5% over the past week, with technical signals flashing overbought conditions as upside momentum begins to show signs of exhaustion. The climb was driven by stronger earnings and persistent dividend stability, but conflicting chart signals cast doubt on whether buyers can sustain recent gains. As the coming week unfolds, the market's focus turns to whether momentum will fade or fresh catalysts can support the advance.
 262.88
Highlights
- McDonald's surged 5.17% over the week, outperforming short- and medium-term averages but still below long-term resistance.
- Momentum is weakening as overbought technicals and recent volatility cap further upside near heavy overhead resistance.
- Shares are expected to consolidate between $271.7 and $282.98 over the next five days, with downside risk outweighing bullish momentum.
Earnings beat and dividend growth offset by margin pressures during week
McDonald's declared a quarterly cash dividend of $1.86 per share, payable on September 16, 2026, to shareholders of record as of September 1, 2026, according to PR Newswire. The company also reported second-quarter earnings that beat analyst expectations, delivering earnings per share of $2.83 on $6.52 billion in revenue, a 9.4% year-over-year increase as reported by Daily Mail Online. Ongoing margin pressures linked to rising beef prices and recent product and technology initiatives remain in focus alongside a steady dividend record for the week ahead.
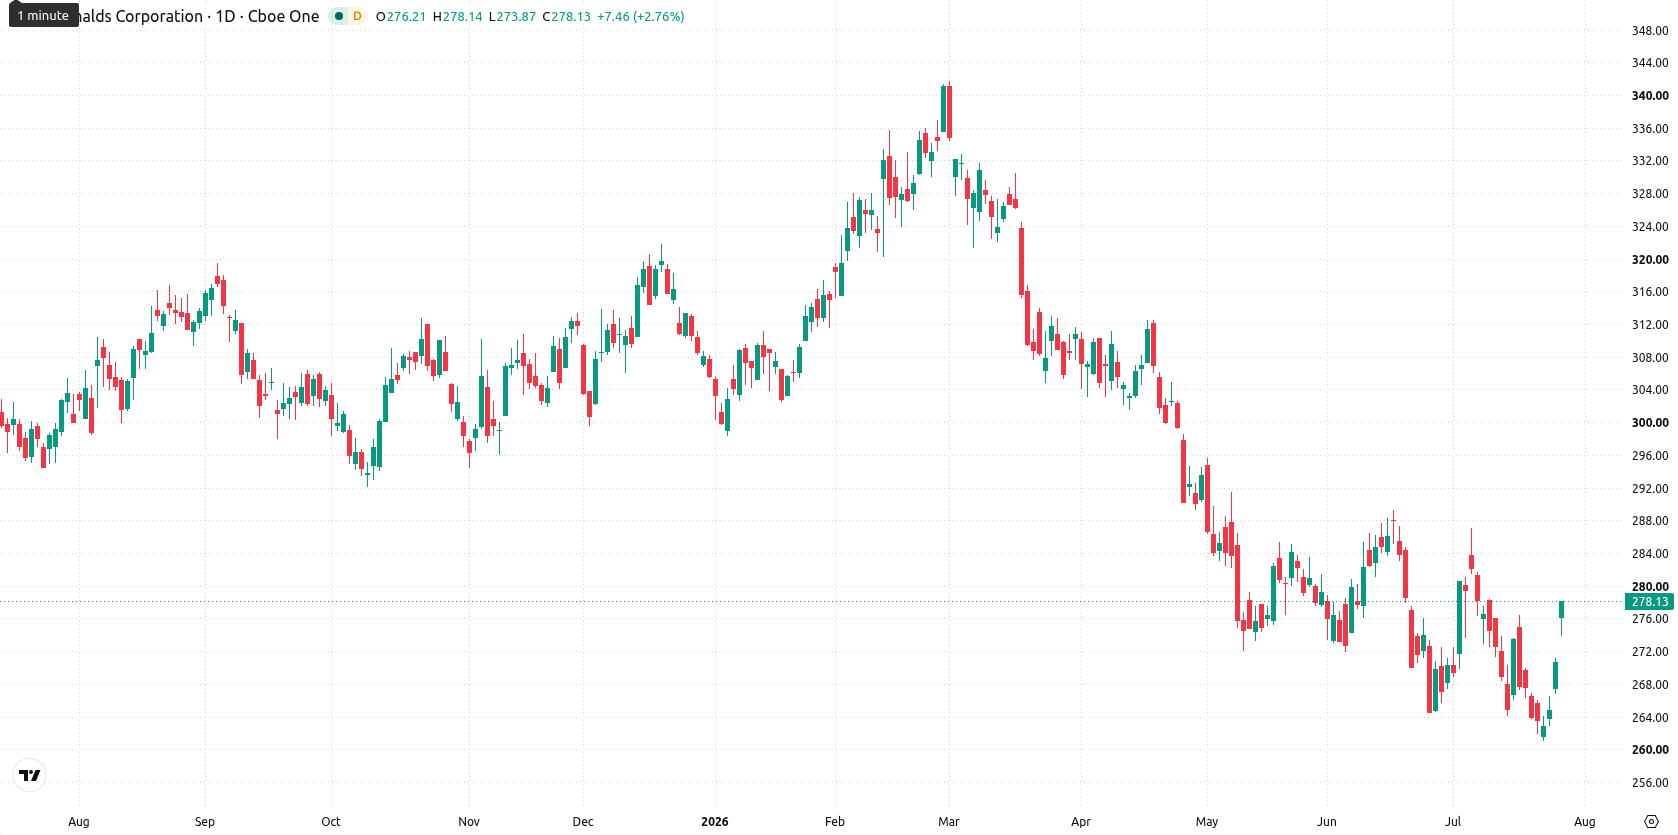
Momentum fades as price tests resistance and overbought signals intensify
On the daily chart, the setup shows momentum fading after this advance, as the stock sits above short- and medium-term moving averages but remains capped below longer-term resistance. The latest Stochastic RSI reading of 86.55 has pushed into overbought territory, while the Bull/Bear Power reading points to buyers dominating the recent move. Volatility reached 3.91% for the week, and the price sits at the very top of its recent trading range. Support is seen at $275.5 from the 50-day moving average and at $274.03 with the Kijun, while resistance stands at $301.01 from the 200-day average.
Bearish bias prevails as breakout risks and support levels eyed next week
Over the next five trading days, the expected range is $271.7 to $282.98, with a 37% probability of an increase and a 63% probability of a decrease. The base case is for consolidation within this range, with a bias toward softening momentum. A sustained push above $301.01 would signal a bullish breakout, while a drop below $275.5 could open up further downside.
Previously it was reported that McDonald's faced persistent bearish momentum, with technical weakness weighing on sentiment. The recent shift to overbought conditions and rally-driven gains introduces the risk of a near-term pullback, making $275.5 a key support level to monitor for signs of renewed downside.






Latest McDonald’s News



-
 Afghanistan
-
 Albania
-
 Algeria
-
 Angola
-
 Argentina
-
 Armenia
-
 Australia
-
 Austria
-
 Azerbaijan
-
 Bahamas
-
 Bahrain
-
 Bangladesh
-
 Belarus
-
 Belgium
-
 Bolivia
-
 Botswana
-
 Brazil
-
 Brunei
-
 Bulgaria
-
 Cambodia
-
 Cameroon
-
 Canada
-
 Chile
-
 China
-
 Colombia
-
 Congo
-
 Costa Rica
-
 Cote d'Ivoire
-
 Croatia
-
 Cuba
-
 Cyprus
-
 Czechia
-
 DR Congo
-
 Denmark
-
 Dominican Republic
-
 Ecuador
-
 Egypt
-
 El Salvador
-
 Estonia
-
 Eswatini
-
 Ethiopia
-
 Finland
-
 France
-
 Georgia
-
 Germany
-
 Ghana
-
 Greece
-
 Haiti
-
 Hong Kong
-
 Hungary
-
 India
-
 Indonesia
-
 Iran, Islamic republic
-
 Iraq
-
 Ireland
-
 Israel
-
 Italy
-
 Jamaica
-
 Japan
-
 Jordan
-
 Kazakhstan
-
 Kenya
-
 Korea
-
 Kuwait
-
 Kyrgyzstan
-
 Laos
-
 Latvia
-
 Lebanon
-
 Lesotho
-
 Libya
-
 Lithuania
-
 Luxembourg
-
 Madagascar
-
 Malaysia
-
 Malta
-
 Mauritius
-
 Mexico
-
 Moldova
-
 Mongolia
-
 Montenegro
-
 Morocco
-
 Mozambique
-
 Myanmar
-
 Namibia
-
 Nepal
-
 Netherlands
-
 New Zealand
-
 Nigeria
-
 North Macedonia
-
 Norway
-
 Oman
-
 Pakistan
-
 Palestine
-
 Panama
-
 Papua New Guinea
-
 Paraguay
-
 Peru
-
 Philippines
-
 Poland
-
 Portugal
-
 Puerto Rico
-
 Qatar
-
 Reunion
-
 Romania
-
 Rwanda
-
 Saudi Arabia
-
 Serbia
-
 Singapore
-
 Slovakia
-
 Slovenia
-
 Somalia
-
 South Africa
-
 Spain
-
 Sri Lanka
-
 Sweden
-
 Switzerland
-
 Syria
-
 Taiwan
-
 Tajikistan
-
 Tanzania
-
 Thailand
-
 Trinidad and Tobago
-
 Tunisia
-
 Turkey
-
 UAE
-
 Uganda
-
 Ukraine
-
 United Kingdom
-
United States
-
 Uruguay
-
 Uzbekistan
-
 Venezuela
-
 Vietnam
-
 Yemen
-
 Zambia
-
 Zimbabwe
- Forex
- Crypto












