

Home Depot stock price prediction: Short-term rally approaches key resistance

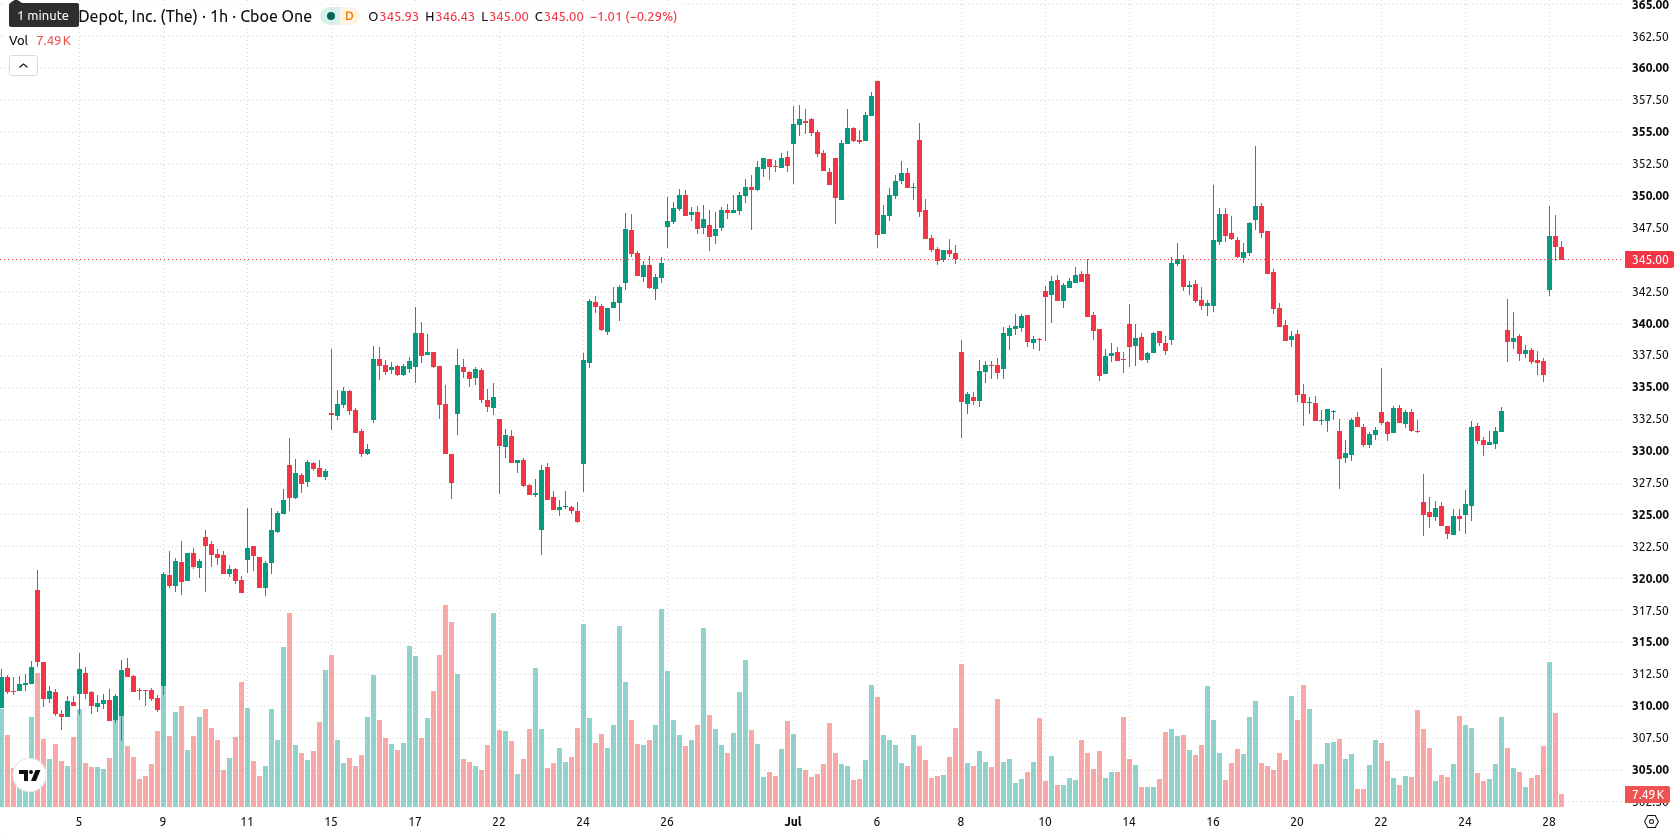
Home Depot (HD) stock is trading at $345.72, up 2.93% on the day. The price currently holds above its key short- and medium-term moving averages, showing near-term upward momentum.
 347.70
349.73
Highlights
- HD/USD maintains a short- to medium-term bullish trend above key moving averages, while longer-term resistance persists.
- Technical momentum indicators show strong upside bias, but overbought conditions suggest potential for near-term consolidation.
- Projected 2–3 day trading range is $337.87 to $353.57, with high probability of sideways to upward movement unless price breaks support or resistance.
Overbought signals as price faces long-term resistance
Price action is supported by technical structures: HD trades above both the MA-20 and MA-50 moving averages, but stays below the MA-200 level, suggesting longer-term resistance overhead. The Ichimoku Kijun stands at $336.07, defining immediate support. On the hourly chart, the momentum remains strong with MACD signaling Buy and a robust ADX confirming trend strength. However, RSI at 76.1, Stoch RSI, and CCI all register overbought readings, indicating stretched short-term conditions. Bull/Bear Power shows buyers remain dominant, and the Awesome Oscillator points to continued upside pressure.
Sideways bias dominates as bullish breakout depends on resistance
Over the next 2–3 trading days, HD is expected to trade within a projected range of $337.87 to $353.57, reflecting typical volatility for the stock at current levels. The probability favors an upward move, with a low chance of a break to the downside. The baseline scenario calls for HD to consolidate sideways within this band. A new bullish leg would require a decisive break above $353.57, while a dip below immediate support near $336 could open a short-term bearish scenario.
Earlier, analysts noted that Home Depot shares were navigating a period of consolidation amid mixed momentum and ongoing corporate shifts. The current strong short-term momentum and renewed buying pressure now highlight $353.57 as a critical resistance level to watch for a potential breakout in the trading days ahead.






Latest Home Depot News




-
 Afghanistan
-
 Albania
-
 Algeria
-
 Angola
-
 Argentina
-
 Armenia
-
 Australia
-
 Austria
-
 Azerbaijan
-
 Bahamas
-
 Bahrain
-
 Bangladesh
-
 Belarus
-
 Belgium
-
 Bolivia
-
 Botswana
-
 Brazil
-
 Brunei
-
 Bulgaria
-
 Cambodia
-
 Cameroon
-
 Canada
-
 Chile
-
 China
-
 Colombia
-
 Congo
-
 Costa Rica
-
 Cote d'Ivoire
-
 Croatia
-
 Cuba
-
 Cyprus
-
 Czechia
-
 DR Congo
-
 Denmark
-
 Dominican Republic
-
 Ecuador
-
 Egypt
-
 El Salvador
-
 Estonia
-
 Eswatini
-
 Ethiopia
-
 Finland
-
 France
-
 Georgia
-
 Germany
-
 Ghana
-
 Greece
-
 Haiti
-
 Hong Kong
-
 Hungary
-
 India
-
 Indonesia
-
 Iran, Islamic republic
-
 Iraq
-
 Ireland
-
 Israel
-
 Italy
-
 Jamaica
-
 Japan
-
 Jordan
-
 Kazakhstan
-
 Kenya
-
 Korea
-
 Kuwait
-
 Kyrgyzstan
-
 Laos
-
 Latvia
-
 Lebanon
-
 Lesotho
-
 Libya
-
 Lithuania
-
 Luxembourg
-
 Madagascar
-
 Malaysia
-
 Malta
-
 Mauritius
-
 Mexico
-
 Moldova
-
 Mongolia
-
 Montenegro
-
 Morocco
-
 Mozambique
-
 Myanmar
-
 Namibia
-
 Nepal
-
 Netherlands
-
 New Zealand
-
 Nigeria
-
 North Macedonia
-
 Norway
-
 Oman
-
 Pakistan
-
 Palestine
-
 Panama
-
 Papua New Guinea
-
 Paraguay
-
 Peru
-
 Philippines
-
 Poland
-
 Portugal
-
 Puerto Rico
-
 Qatar
-
 Reunion
-
 Romania
-
 Rwanda
-
 Saudi Arabia
-
 Serbia
-
 Singapore
-
 Slovakia
-
 Slovenia
-
 Somalia
-
 South Africa
-
 Spain
-
 Sri Lanka
-
 Sweden
-
 Switzerland
-
 Syria
-
 Taiwan
-
 Tajikistan
-
 Tanzania
-
 Thailand
-
 Trinidad and Tobago
-
 Tunisia
-
 Turkey
-
 UAE
-
 Uganda
-
 Ukraine
-
 United Kingdom
-
United States
-
 Uruguay
-
 Uzbekistan
-
 Venezuela
-
 Vietnam
-
 Yemen
-
 Zambia
-
 Zimbabwe
- Forex
- Crypto












