

What's behind T-Mobile US's latest 3.6% stock surge?

T-Mobile US, Inc. (TMUS) climbed 3.62% after reporting strong second-quarter earnings and expanding its share repurchase program, fueling renewed buying interest. The rebound looks limited, with price action remaining capped by resistance at the 50- and 200-day moving averages.
 163.30
Highlights
- T-Mobile US raised its full-year free cash flow outlook to $18.4 billion, reflecting higher-than-anticipated customer additions in Q2 2026.
- The company confirmed ongoing capital returns through an expanded share repurchase program, with increased hedge fund and fund manager positions.
- Despite strong intraday gains, technical indicators suggest weak momentum and a high probability of the stock testing support near $171.79 in the coming days.
Shareholder payouts and fund interest rise as guidance improves
T-Mobile US released second-quarter 2026 earnings and updated its share repurchase program, confirming continued capital returns to shareholders. The company also reported strong customer growth and robust profitability, maintaining guidance for free cash flow and postpaid customer growth through 2025. Full-year cash flow targets were raised to $18.4 billion after better-than-expected new customer additions, and T-Mobile US was highlighted as a holding by the Carillon Eagle Growth & Income Fund, alongside an increase in hedge fund positions to 85 by the end of the first quarter of 2026.
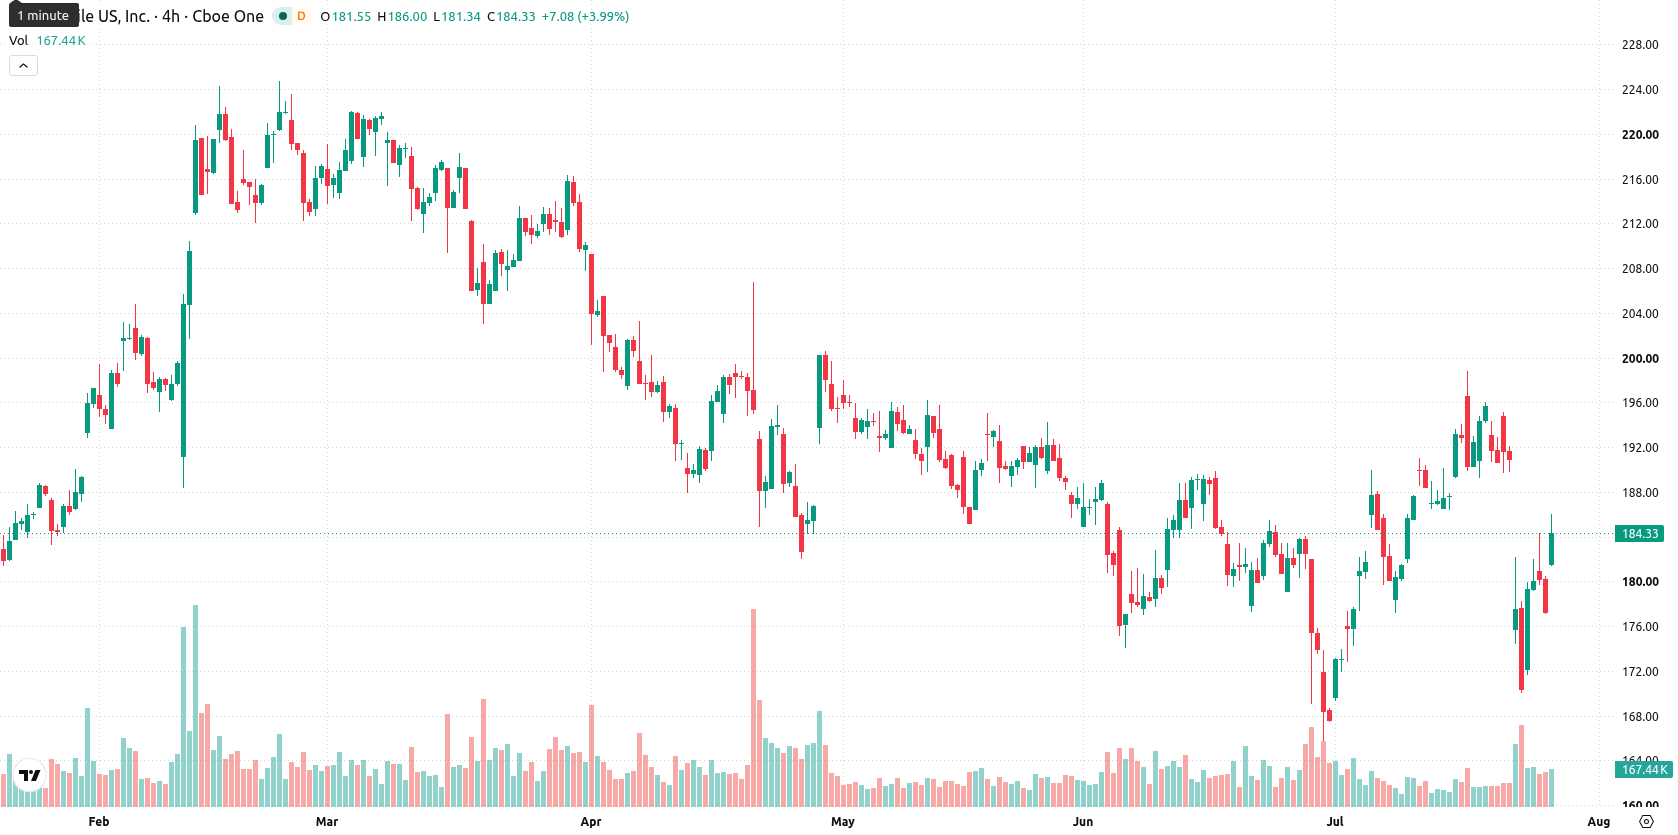
Mixed momentum signals highlight bearish trend amid technical barriers
TMUS is trading above its 20-day moving average ($183.12) but remains below both the 50-day ($184.55) and 200-day ($200.05) moving averages, indicating short-term resilience but continued medium- and long-term pressure from sellers. The Ichimoku Kijun at $181.08 signals support below, with a near-term floor at $183.12 and resistance at $184.55. The long-term trend is bearish, as the 50-day moving average remains under the 200-day. Momentum indicators are mixed: MACD is neutral, ADX points to a weak trend, and RSI at 44.38 aligns with a ‘Sell’ signal and lack of bullish momentum. Stochastic RSI and CCI provide neutral readings, while BBP indicates sellers have slight intraday dominance with an ‘Oversold’ forecast. Volatility is moderate, with price action consolidating in the mid-range for the day.
Earlier, analysts noted that T-Mobile US faced persistent downside risk amid technical caution and range-bound trading. With the latest earnings beat and increased buybacks providing a bullish catalyst but resistance levels still holding, investors should monitor for a sustained breakout above $184.55 to confirm a shift in trend.









-
 Afghanistan
-
 Albania
-
 Algeria
-
 Angola
-
 Argentina
-
 Armenia
-
 Australia
-
 Austria
-
 Azerbaijan
-
 Bahamas
-
 Bahrain
-
 Bangladesh
-
 Belarus
-
 Belgium
-
 Bolivia
-
 Botswana
-
 Brazil
-
 Brunei
-
 Bulgaria
-
 Cambodia
-
 Cameroon
-
 Canada
-
 Chile
-
 China
-
 Colombia
-
 Congo
-
 Costa Rica
-
 Cote d'Ivoire
-
 Croatia
-
 Cuba
-
 Cyprus
-
 Czechia
-
 DR Congo
-
 Denmark
-
 Dominican Republic
-
 Ecuador
-
 Egypt
-
 El Salvador
-
 Estonia
-
 Eswatini
-
 Ethiopia
-
 Finland
-
 France
-
 Georgia
-
 Germany
-
 Ghana
-
 Greece
-
 Haiti
-
 Hong Kong
-
 Hungary
-
 India
-
 Indonesia
-
 Iran, Islamic republic
-
 Iraq
-
 Ireland
-
 Israel
-
 Italy
-
 Jamaica
-
 Japan
-
 Jordan
-
 Kazakhstan
-
 Kenya
-
 Korea
-
 Kuwait
-
 Kyrgyzstan
-
 Laos
-
 Latvia
-
 Lebanon
-
 Lesotho
-
 Libya
-
 Lithuania
-
 Luxembourg
-
 Madagascar
-
 Malaysia
-
 Malta
-
 Mauritius
-
 Mexico
-
 Moldova
-
 Mongolia
-
 Montenegro
-
 Morocco
-
 Mozambique
-
 Myanmar
-
 Namibia
-
 Nepal
-
 Netherlands
-
 New Zealand
-
 Nigeria
-
 North Macedonia
-
 Norway
-
 Oman
-
 Pakistan
-
 Palestine
-
 Panama
-
 Papua New Guinea
-
 Paraguay
-
 Peru
-
 Philippines
-
 Poland
-
 Portugal
-
 Puerto Rico
-
 Qatar
-
 Reunion
-
 Romania
-
 Rwanda
-
 Saudi Arabia
-
 Serbia
-
 Singapore
-
 Slovakia
-
 Slovenia
-
 Somalia
-
 South Africa
-
 Spain
-
 Sri Lanka
-
 Sweden
-
 Switzerland
-
 Syria
-
 Taiwan
-
 Tajikistan
-
 Tanzania
-
 Thailand
-
 Trinidad and Tobago
-
 Tunisia
-
 Turkey
-
 UAE
-
 Uganda
-
 Ukraine
-
 United Kingdom
-
United States
-
 Uruguay
-
 Uzbekistan
-
 Venezuela
-
 Vietnam
-
 Yemen
-
 Zambia
-
 Zimbabwe
- Forex
- Crypto












