

T-Mobile enters new competitive landscape: Can TMUS recover from its latest decline?

T-Mobile US, Inc. (TMUS) stock is trading at $150.07, marking a daily decline of 5.52%. The price currently sits below its key moving averages.
 158.97
Highlights
- SpaceX has entered the terrestrial wireless market, increasing competitive pressure for shares of T-Mobile US.
- T-Mobile stock faces uncertainty ahead of its third-quarter earnings announcement, affecting outlook on future market share and growth.
- T-Mobile shares trade below key moving averages with a projected range of $146.34 to $153.8 and a high probability of further downside.
Competitive threat from SpaceX and earnings uncertainty spur investor caution
SpaceX has entered the terrestrial wireless infrastructure market, intensifying competitive pressure for T-Mobile US Inc. and raising market concerns about the company's future share and growth prospects. Additionally, the upcoming third-quarter earnings announcement has introduced further uncertainty, prompting investor caution as participants await key financial results. These conditions have contributed to a more guarded sentiment toward T-Mobile in the current session.
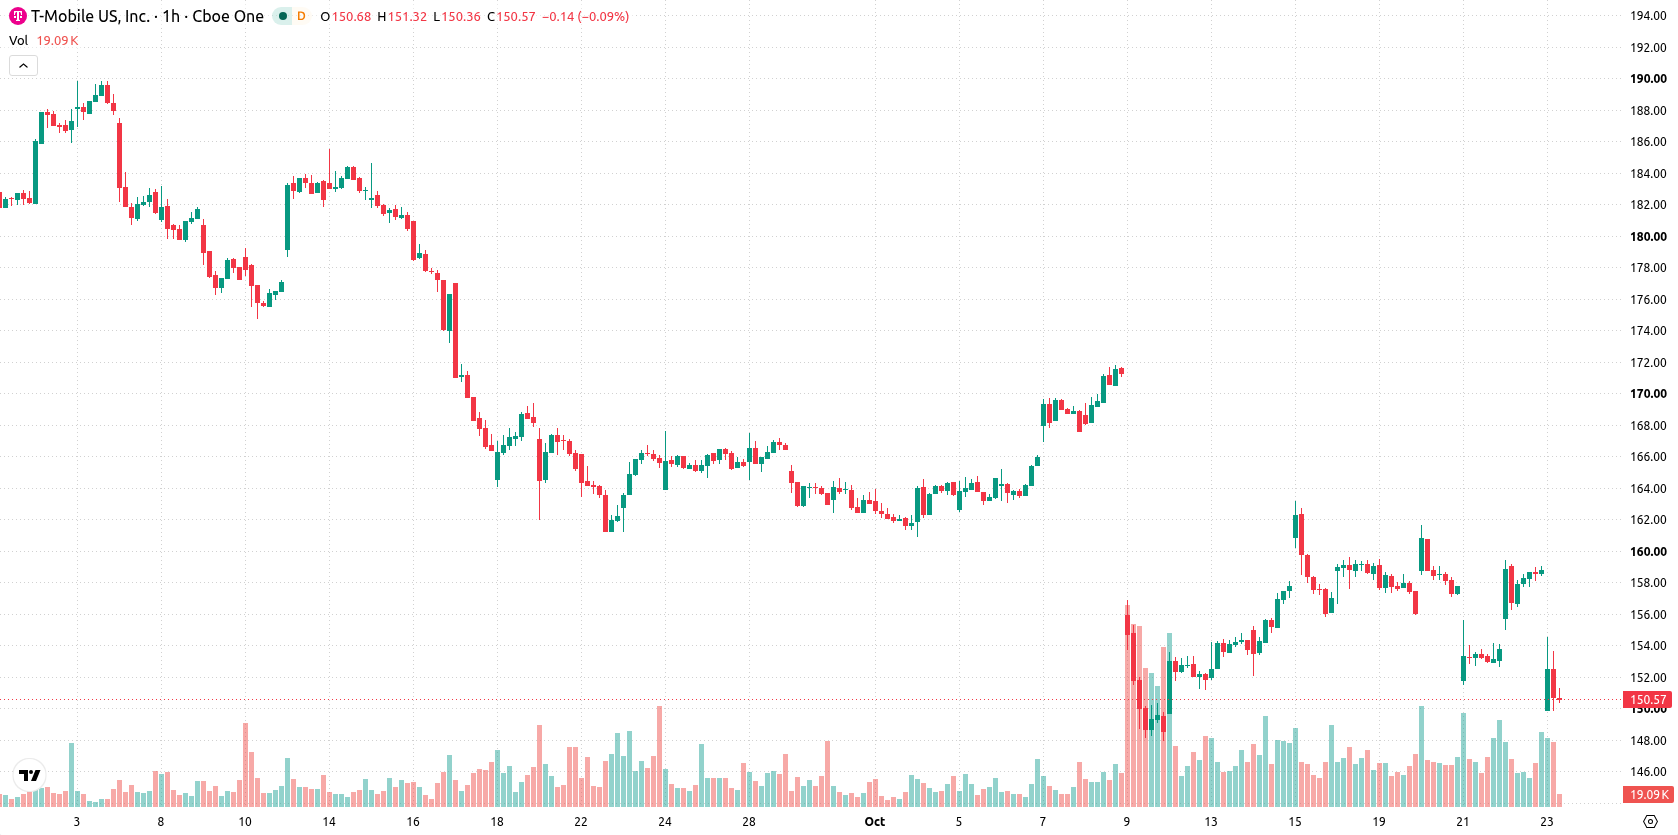
Resistance at Kijun and mixed signals create tug-of-war at session low
TMUS is trading beneath its MA-20 at $156.5 and MA-50 at $157.2 on the hourly chart, with the longer-term MA-200 at $188.37 remaining unchallenged above. The Ichimoku Kijun level at $156.57 stands as immediate resistance for any short-term rebound. Indicator signals are mixed: MACD and ADX are neutral, RSI is registering 57.28, CCI and Awesome Oscillator both reflect a buy condition, while Stoch RSI and Bull/Bear Power show overbought levels, highlighting strong intraday buyer activity. An opening gap down of $5.71 has TMUS near its session low amid moderate volatility, and divergence among these signals reflects an ongoing struggle between buyers and sellers.
Sideways movement expected amid key resistance and support levels
Over the next several sessions, TMUS is projected to fluctuate within a volatility band between $146.34 and $153.8. The short-term baseline scenario anticipates a sideways move within this range. A break above $156.57 would set up the potential for a recovery, while a drop under support at $146.34 would likely reinforce prevailing selling pressure, increasing the probability of further declines.
Earlier, analysts noted that T-Mobile was grappling with sustained downside risk amid technical indecision and heightened competition. The current analysis reinforces this cautious outlook, with intensified industry rivalry and pre-earnings uncertainty highlighting $146.34 as a pivotal support level to monitor for potential further weakness.









-
 Afghanistan
-
 Albania
-
 Algeria
-
 Angola
-
 Argentina
-
 Armenia
-
 Australia
-
 Austria
-
 Azerbaijan
-
 Bahamas
-
 Bahrain
-
 Bangladesh
-
 Belarus
-
 Belgium
-
 Bolivia
-
 Botswana
-
 Brazil
-
 Brunei
-
 Bulgaria
-
 Cambodia
-
 Cameroon
-
 Canada
-
 Chile
-
 China
-
 Colombia
-
 Congo
-
 Costa Rica
-
 Cote d'Ivoire
-
 Croatia
-
 Cuba
-
 Cyprus
-
 Czechia
-
 DR Congo
-
 Denmark
-
 Dominican Republic
-
 Ecuador
-
 Egypt
-
 El Salvador
-
 Estonia
-
 Eswatini
-
 Ethiopia
-
 Finland
-
 France
-
 Georgia
-
 Germany
-
 Ghana
-
 Greece
-
 Haiti
-
 Hong Kong
-
 Hungary
-
 India
-
 Indonesia
-
 Iran, Islamic republic
-
 Iraq
-
 Ireland
-
 Israel
-
 Italy
-
 Jamaica
-
 Japan
-
 Jordan
-
 Kazakhstan
-
 Kenya
-
 Korea
-
 Kuwait
-
 Kyrgyzstan
-
 Laos
-
 Latvia
-
 Lebanon
-
 Lesotho
-
 Libya
-
 Lithuania
-
 Luxembourg
-
 Madagascar
-
 Malaysia
-
 Malta
-
 Mauritius
-
 Mexico
-
 Moldova
-
 Mongolia
-
 Montenegro
-
 Morocco
-
 Mozambique
-
 Myanmar
-
 Namibia
-
 Nepal
-
 Netherlands
-
 New Zealand
-
 Nigeria
-
 North Macedonia
-
 Norway
-
 Oman
-
 Pakistan
-
 Palestine
-
 Panama
-
 Papua New Guinea
-
 Paraguay
-
 Peru
-
 Philippines
-
 Poland
-
 Portugal
-
 Puerto Rico
-
 Qatar
-
 Reunion
-
 Romania
-
 Rwanda
-
 Saudi Arabia
-
 Serbia
-
 Singapore
-
 Slovakia
-
 Slovenia
-
 Somalia
-
 South Africa
-
 Spain
-
 Sri Lanka
-
 Sweden
-
 Switzerland
-
 Syria
-
 Taiwan
-
 Tajikistan
-
 Tanzania
-
 Thailand
-
 Trinidad and Tobago
-
 Tunisia
-
 Turkey
-
 UAE
-
 Uganda
-
 Ukraine
-
 United Kingdom
-
United States
-
 Uruguay
-
 Uzbekistan
-
 Venezuela
-
 Vietnam
-
 Yemen
-
 Zambia
-
 Zimbabwe
- Forex
- Crypto












