


SS&C Technologies Holdings, Inc. (SSNC) surged 4.36% as technical momentum and persistent buying pressure dominated intraday trading. The move is robustly supported by the stock's decisive break above all major moving averages, confirming short-, medium-, and long-term bullish momentum.
 76.73
80.30
Highlights
- SS&C Technologies sustains bullish momentum, trading above major moving averages as buyers drive a 4.36% gain intraday.
- Multiple overbought signals from technical indicators indicate strong short-term buying pressure and elevated risk of a pullback.
- For the next five sessions, price forecast is $73.39–$83.23 with 78% probability of an upward break above $78.74 resistance.
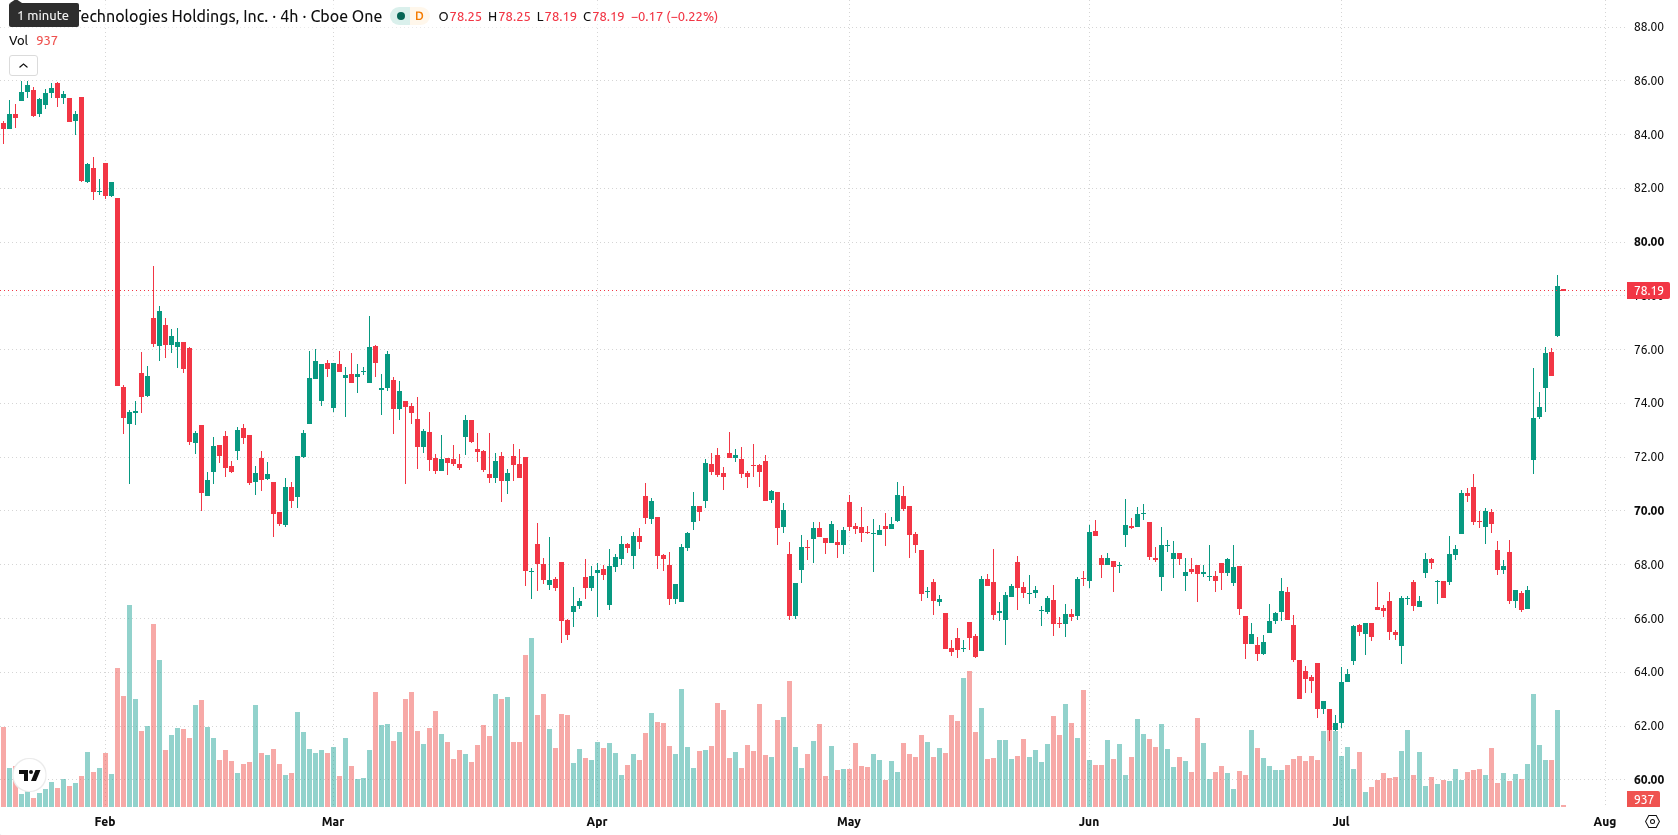
Mixed momentum as bullish average crossover meets overbought signals
SSNC is trading above its 20-day, 50-day, and 200-day moving averages ($67.44, $67.11, and $75.7 respectively), confirming bullish momentum across the short, medium, and long term. The nearest resistance is the near-term ceiling at $78.74, with initial support found at the near-term floor of $76.33. The longer-term trend remains constrained by a bearish MA-50 versus MA-200 alignment. Momentum signals are mixed, with a positive MACD forecasting a buy, a neutral ADX, and overbought conditions indicated by an RSI of 69.22, CCI of 216.2, Stochastic RSI at 100, and BBP at 6.68. The Awesome Oscillator supports the prevailing uptrend. The stock is up $3.27 today after an upside gap of $1.29. Price remains near the intraday high with volatility at 3.16%, and intraday bias continues to favor further strength.
Earlier, analysts noted persistent bearish momentum and technical weakness for SS&C Technologies. The current breakout above all major moving averages signals a shift toward bullish control, and traders should now monitor the $78.74 resistance for signs of continued upside momentum.






Latest SS&C Technologies Holdings News





-
 Afghanistan
-
 Albania
-
 Algeria
-
 Angola
-
 Argentina
-
 Armenia
-
 Australia
-
 Austria
-
 Azerbaijan
-
 Bahamas
-
 Bahrain
-
 Bangladesh
-
 Belarus
-
 Belgium
-
 Bolivia
-
 Botswana
-
 Brazil
-
 Brunei
-
 Bulgaria
-
 Cambodia
-
 Cameroon
-
 Canada
-
 Chile
-
 China
-
 Colombia
-
 Congo
-
 Costa Rica
-
 Cote d'Ivoire
-
 Croatia
-
 Cuba
-
 Cyprus
-
 Czechia
-
 DR Congo
-
 Denmark
-
 Dominican Republic
-
 Ecuador
-
 Egypt
-
 El Salvador
-
 Estonia
-
 Eswatini
-
 Ethiopia
-
 Finland
-
 France
-
 Georgia
-
 Germany
-
 Ghana
-
 Greece
-
 Haiti
-
 Hong Kong
-
 Hungary
-
 India
-
 Indonesia
-
 Iran, Islamic republic
-
 Iraq
-
 Ireland
-
 Israel
-
 Italy
-
 Jamaica
-
 Japan
-
 Jordan
-
 Kazakhstan
-
 Kenya
-
 Korea
-
 Kuwait
-
 Kyrgyzstan
-
 Laos
-
 Latvia
-
 Lebanon
-
 Lesotho
-
 Libya
-
 Lithuania
-
 Luxembourg
-
 Madagascar
-
 Malaysia
-
 Malta
-
 Mauritius
-
 Mexico
-
 Moldova
-
 Mongolia
-
 Montenegro
-
 Morocco
-
 Mozambique
-
 Myanmar
-
 Namibia
-
 Nepal
-
 Netherlands
-
 New Zealand
-
 Nigeria
-
 North Macedonia
-
 Norway
-
 Oman
-
 Pakistan
-
 Palestine
-
 Panama
-
 Papua New Guinea
-
 Paraguay
-
 Peru
-
 Philippines
-
 Poland
-
 Portugal
-
 Puerto Rico
-
 Qatar
-
 Reunion
-
 Romania
-
 Rwanda
-
 Saudi Arabia
-
 Serbia
-
 Singapore
-
 Slovakia
-
 Slovenia
-
 Somalia
-
 South Africa
-
 Spain
-
 Sri Lanka
-
 Sweden
-
 Switzerland
-
 Syria
-
 Taiwan
-
 Tajikistan
-
 Tanzania
-
 Thailand
-
 Trinidad and Tobago
-
 Tunisia
-
 Turkey
-
 UAE
-
 Uganda
-
 Ukraine
-
 United Kingdom
-
United States
-
 Uruguay
-
 Uzbekistan
-
 Venezuela
-
 Vietnam
-
 Yemen
-
 Zambia
-
 Zimbabwe
- Forex
- Crypto












