

What's behind Verisk Analytics's latest stock surge?

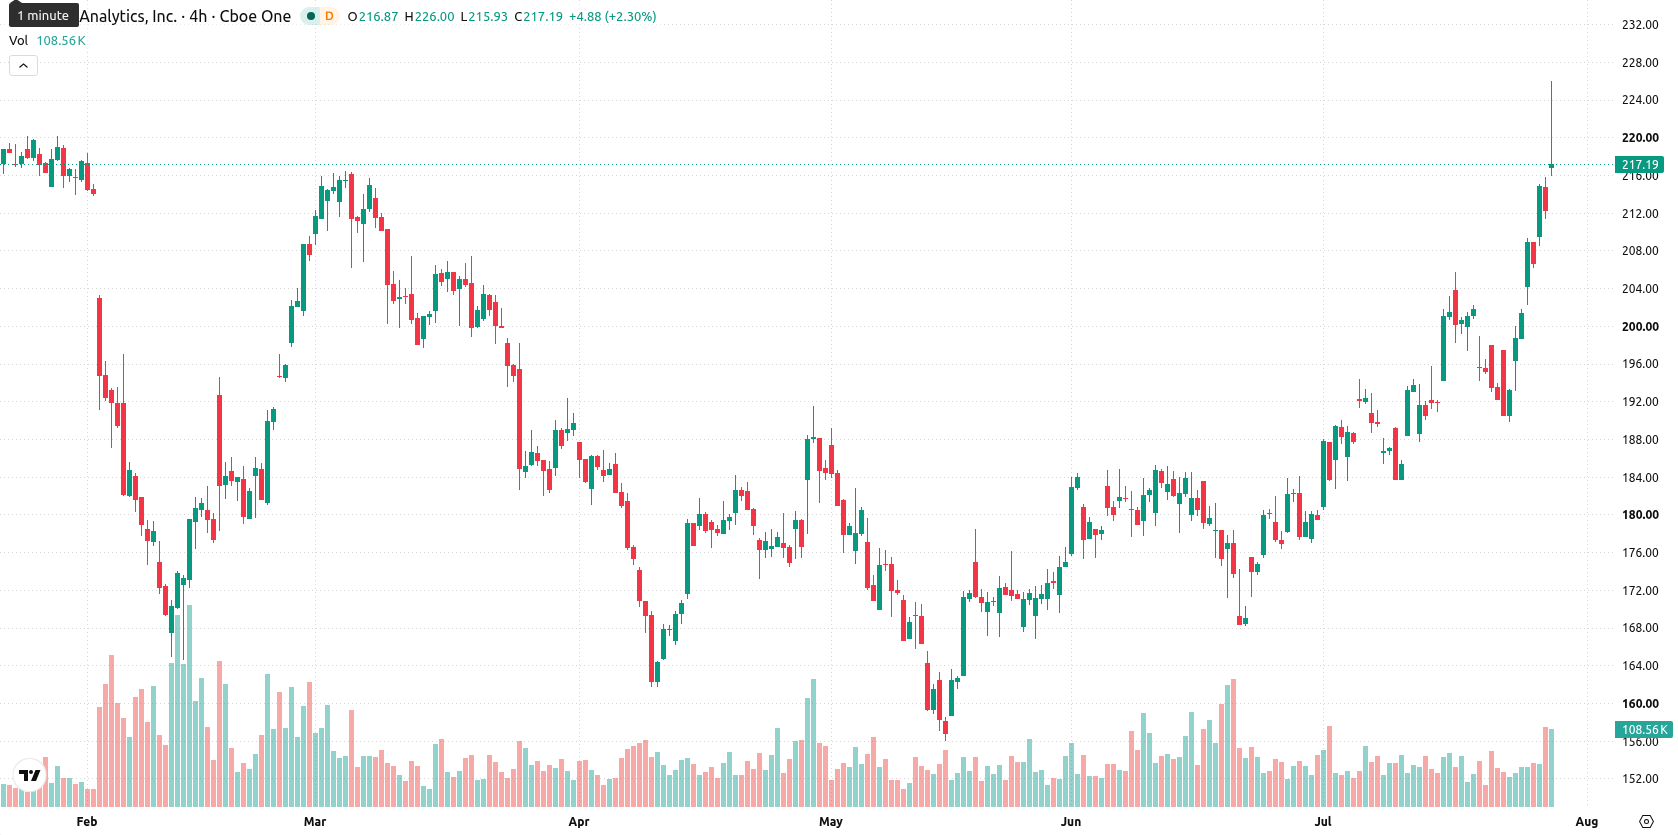
Verisk Analytics, Inc. (VRSK) climbed 2.88% after reporting stronger-than-expected Q2 results and reaffirming its full-year outlook, with buying interest fueled by a robust earnings beat and continued capital returns. The rally is reinforced by a clear bullish technical setup as the price trades above all major moving averages, though lingering bearish trend structure in MA alignment and overbought indicators suggest further gains may be constrained in the near term.
 189.64
203.95
Highlights
- Verisk Analytics delivered Q2 2026 revenue of $806 million, up 4.3% year-over-year, with adjusted EPS of $1.98 surpassing expectations.
- Management reaffirmed full-year revenue and EPS guidance while executing a $200 million share buyback and distributing a $0.50 dividend.
- Shares exhibit strong bullish momentum and sustained buyer dominance, with a likely trading range of $205.34 to $231.41 and high odds of an upward breakout above $225.84.
Revenue growth and capital returns underpin positive market sentiment
Verisk Analytics reported second quarter 2026 revenue of $806 million, a 4.3% increase year-over-year and up 5.8% on an organic constant currency basis. The company delivered net income of $229 million and adjusted diluted EPS of $1.98, surpassing consensus estimates by $0.05. Verisk executed a $200 million accelerated share repurchase program and paid a $0.50 per share dividend on June 30, 2026, while reaffirming its full-year EPS and revenue guidance.
Bullish momentum meets resistance as overbought signals intensify
Verisk Analytics is trading above all major moving averages, with the price at $218.38 positioned above the 20-day ($193.74), 50-day ($183.38), and 200-day ($199.79) levels, affirming persistent bullish momentum across all observed timeframes. The nearest trading levels are the recent high at $225.84 (near-term ceiling) and today’s low at $217.48 (near-term floor), with the Ichimoku Kijun ($191.97) confirming long-term trend support and the MA-50 vs MA-200 alignment reflecting a lingering bearish tone in trend structure. Momentum indicators point to sustained buyer dominance: the Moving Average Convergence Divergence (MACD) and Average Directional Index (ADX) both signal a clear buy, supported by the Awesome Oscillator. However, the Relative Strength Index (RSI) at 69.83 and Commodity Channel Index (CCI) at 208.07 both warn of overbought conditions, and both the Stochastic RSI and Bull/Bear Power (BBP) indicate extreme overbought readings, confirming that buyers strongly dominate intraday sentiment. After an upside gap of $5.22 (2.46%), the stock gained $6.12 (2.88%) and is trading near the low of the daily range, with intraday volatility standing at 3.84%. Early upward momentum has met some resistance to further gains, setting a mixed intraday tone despite strong underlying buying strength.
Previously it was reported that Verisk Analytics was exhibiting strong bullish momentum across multiple timeframes, though analysts advised caution due to emerging signs of overextension and the potential for short-term consolidation. With fresh earnings strength and reinforced technical signals, the prevailing scenario favors further upside within the current volatility band, but traders should closely monitor for a confirmed breakout above $225.84 to validate renewed bullish continuation.






Latest Verisk Analytics News




-
 Afghanistan
-
 Albania
-
 Algeria
-
 Angola
-
 Argentina
-
 Armenia
-
 Australia
-
 Austria
-
 Azerbaijan
-
 Bahamas
-
 Bahrain
-
 Bangladesh
-
 Belarus
-
 Belgium
-
 Bolivia
-
 Botswana
-
 Brazil
-
 Brunei
-
 Bulgaria
-
 Cambodia
-
 Cameroon
-
 Canada
-
 Chile
-
 China
-
 Colombia
-
 Congo
-
 Costa Rica
-
 Cote d'Ivoire
-
 Croatia
-
 Cuba
-
 Cyprus
-
 Czechia
-
 DR Congo
-
 Denmark
-
 Dominican Republic
-
 Ecuador
-
 Egypt
-
 El Salvador
-
 Estonia
-
 Eswatini
-
 Ethiopia
-
 Finland
-
 France
-
 Georgia
-
 Germany
-
 Ghana
-
 Greece
-
 Haiti
-
 Hong Kong
-
 Hungary
-
 India
-
 Indonesia
-
 Iran, Islamic republic
-
 Iraq
-
 Ireland
-
 Israel
-
 Italy
-
 Jamaica
-
 Japan
-
 Jordan
-
 Kazakhstan
-
 Kenya
-
 Korea
-
 Kuwait
-
 Kyrgyzstan
-
 Laos
-
 Latvia
-
 Lebanon
-
 Lesotho
-
 Libya
-
 Lithuania
-
 Luxembourg
-
 Madagascar
-
 Malaysia
-
 Malta
-
 Mauritius
-
 Mexico
-
 Moldova
-
 Mongolia
-
 Montenegro
-
 Morocco
-
 Mozambique
-
 Myanmar
-
 Namibia
-
 Nepal
-
 Netherlands
-
 New Zealand
-
 Nigeria
-
 North Macedonia
-
 Norway
-
 Oman
-
 Pakistan
-
 Palestine
-
 Panama
-
 Papua New Guinea
-
 Paraguay
-
 Peru
-
 Philippines
-
 Poland
-
 Portugal
-
 Puerto Rico
-
 Qatar
-
 Reunion
-
 Romania
-
 Rwanda
-
 Saudi Arabia
-
 Serbia
-
 Singapore
-
 Slovakia
-
 Slovenia
-
 Somalia
-
 South Africa
-
 Spain
-
 Sri Lanka
-
 Sweden
-
 Switzerland
-
 Syria
-
 Taiwan
-
 Tajikistan
-
 Tanzania
-
 Thailand
-
 Trinidad and Tobago
-
 Tunisia
-
 Turkey
-
 UAE
-
 Uganda
-
 Ukraine
-
 United Kingdom
-
United States
-
 Uruguay
-
 Uzbekistan
-
 Venezuela
-
 Vietnam
-
 Yemen
-
 Zambia
-
 Zimbabwe
- Forex
- Crypto












