

Will Johnson & Johnson stock hold support as Firefly Bio acquisition triggers profit warning?

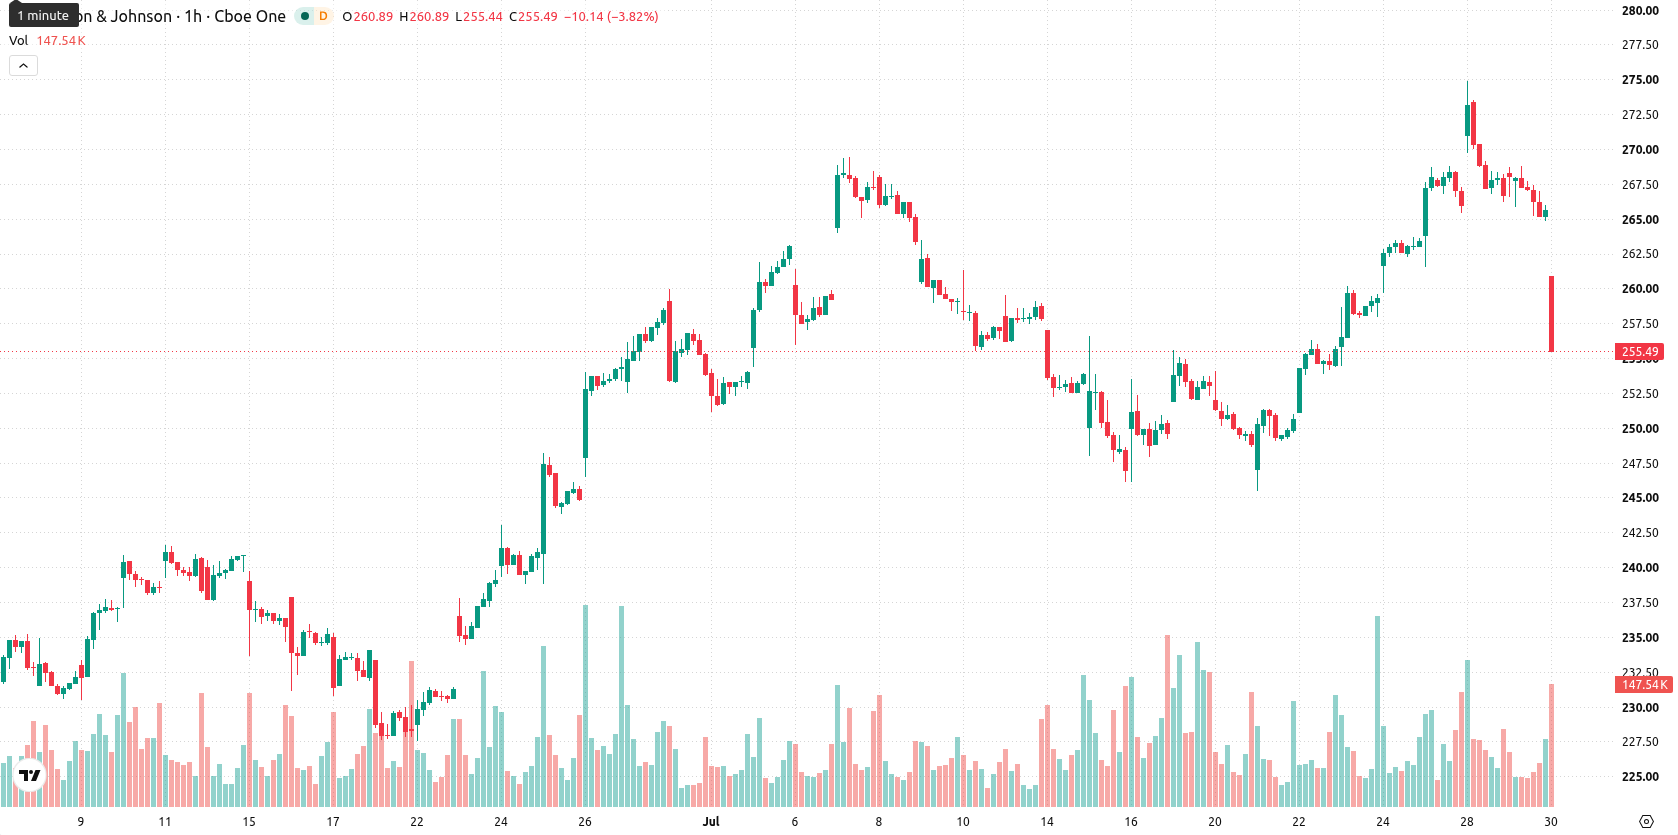
Johnson & Johnson (JNJ) stock is trading at $256.02, down 3.58% for the day and closing near the session’s low. The price sits below its short- and medium-term moving averages but remains above long-term trend levels.
 282.02
Highlights
- Johnson & Johnson’s $1 billion Firefly Bio acquisition expands its oncology pipeline but triggers a significant in-process R&D charge in Q3 2026.
- Lowered 2026 profit guidance, attributed to Firefly Bio and Sail Biomedicines, reflects management’s near-term caution on reported earnings.
- Technicals indicate strong selling momentum, with a 64% probability of further downside in the $249.96 to $265.31 price range.
Profit forecast cut and R&D charge as Firefly Bio deal closes
Johnson & Johnson has completed its $1 billion acquisition of Firefly Bio, Inc., expanding its oncology portfolio with the proprietary Firelink degrader antibody conjugate (DAC) platform, according to Lasvegassun. The deal, accounted for as an asset acquisition, will result in a $1 billion in-process R&D charge in the third quarter of 2026, weighing on short-term reported earnings and contributing to near-term caution among investors. Johnson & Johnson has also lowered its 2026 profit forecast, linking the adjustment to the Firefly Bio transaction and its partnership with Sail Biomedicines, while the commercial rollout of the TECNIS PureSee intraocular lens following FDA clearance may support future growth but does not offset immediate cost concerns.
Oversold signals and resistance cap as sellers dominate momentum
On the technical front, JNJ is trading below the MA-20 at $267.11 and MA-50 at $261.64 on the H1 chart, staying above the longer-term MA-200 at $225.78. Immediate resistance is identified at the Ichimoku Kijun level of $266.21. Momentum readings indicate continued downside, with RSI at 30.6, ADX signaling a sell, and Bull/Bear Power showing sellers in control. The MACD is neutral, but Stoch RSI, CCI, and the Awesome Oscillator all register as oversold or reflect strong short-term selling pressure.
Short-term consolidation likely as downside risk outweighs rebound
Over the coming 2–3 trading days, JNJ is expected to trade within a volatility band of $249.96 to $265.31. The probability of a further downside move is assessed at 64%, versus a 36% chance of an upward recovery. The baseline scenario anticipates short-term consolidation inside this range. A move above $266.21 could trigger additional buying and test higher resistance, while a break below $249.96 would suggest further short-term weakness.
Previously it was reported that Johnson & Johnson shares reached new highs following a major legal settlement over talc-related litigation and growing investor confidence in its pharmaceuticals and medical technology divisions. The current environment introduces renewed short-term caution due to acquisition-related costs and revised earnings guidance, making the $249.96 level a critical support to monitor for potential further downside risk in the near term.











-
 Afghanistan
-
 Albania
-
 Algeria
-
 Angola
-
 Argentina
-
 Armenia
-
 Australia
-
 Austria
-
 Azerbaijan
-
 Bahamas
-
 Bahrain
-
 Bangladesh
-
 Belarus
-
 Belgium
-
 Bolivia
-
 Botswana
-
 Brazil
-
 Brunei
-
 Bulgaria
-
 Cambodia
-
 Cameroon
-
 Canada
-
 Chile
-
 China
-
 Colombia
-
 Congo
-
 Costa Rica
-
 Cote d'Ivoire
-
 Croatia
-
 Cuba
-
 Cyprus
-
 Czechia
-
 DR Congo
-
 Denmark
-
 Dominican Republic
-
 Ecuador
-
 Egypt
-
 El Salvador
-
 Estonia
-
 Eswatini
-
 Ethiopia
-
 Finland
-
 France
-
 Georgia
-
 Germany
-
 Ghana
-
 Greece
-
 Haiti
-
 Hong Kong
-
 Hungary
-
 India
-
 Indonesia
-
 Iran, Islamic republic
-
 Iraq
-
 Ireland
-
 Israel
-
 Italy
-
 Jamaica
-
 Japan
-
 Jordan
-
 Kazakhstan
-
 Kenya
-
 Korea
-
 Kuwait
-
 Kyrgyzstan
-
 Laos
-
 Latvia
-
 Lebanon
-
 Lesotho
-
 Libya
-
 Lithuania
-
 Luxembourg
-
 Madagascar
-
 Malaysia
-
 Malta
-
 Mauritius
-
 Mexico
-
 Moldova
-
 Mongolia
-
 Montenegro
-
 Morocco
-
 Mozambique
-
 Myanmar
-
 Namibia
-
 Nepal
-
 Netherlands
-
 New Zealand
-
 Nigeria
-
 North Macedonia
-
 Norway
-
 Oman
-
 Pakistan
-
 Palestine
-
 Panama
-
 Papua New Guinea
-
 Paraguay
-
 Peru
-
 Philippines
-
 Poland
-
 Portugal
-
 Puerto Rico
-
 Qatar
-
 Reunion
-
 Romania
-
 Rwanda
-
 Saudi Arabia
-
 Serbia
-
 Singapore
-
 Slovakia
-
 Slovenia
-
 Somalia
-
 South Africa
-
 Spain
-
 Sri Lanka
-
 Sweden
-
 Switzerland
-
 Syria
-
 Taiwan
-
 Tajikistan
-
 Tanzania
-
 Thailand
-
 Trinidad and Tobago
-
 Tunisia
-
 Turkey
-
 UAE
-
 Uganda
-
 Ukraine
-
 United Kingdom
-
United States
-
 Uruguay
-
 Uzbekistan
-
 Venezuela
-
 Vietnam
-
 Yemen
-
 Zambia
-
 Zimbabwe
- Forex
- Crypto












