

What's behind Edison International's latest stock pullback?

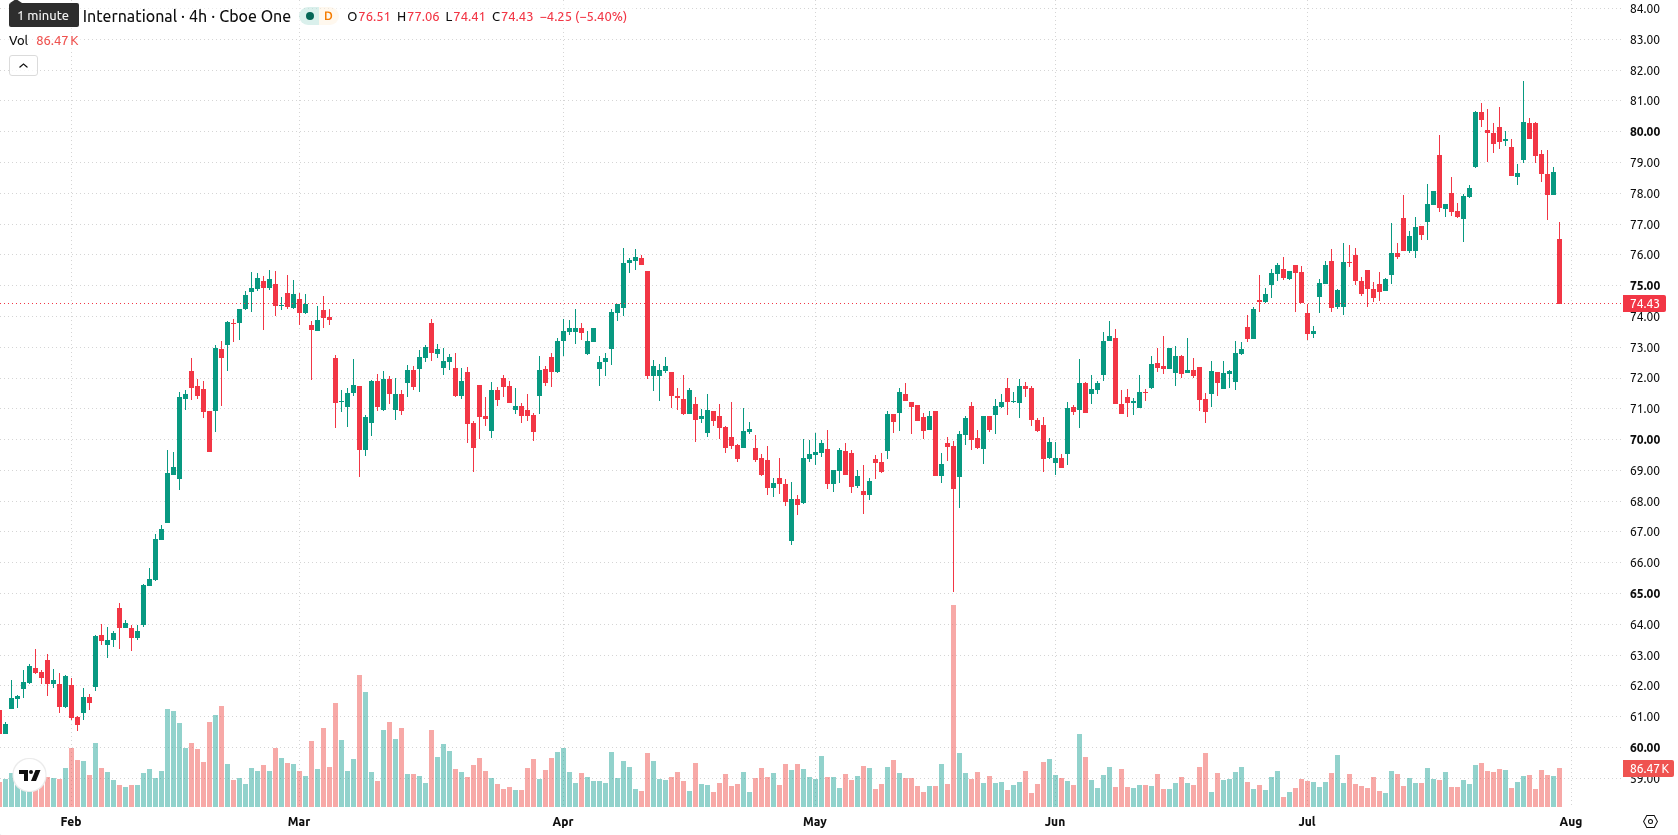
Edison International (EIX) slumped 4.99% after the company reported a significant increase in quarterly core earnings and reaffirmed its full-year guidance. The drop is working against these fundamentals, with short-term selling pressure showing in the price slipping below its 20-day moving average even as medium- and long-term technicals remain supportive.
 60.42
62.36
Highlights
- Edison International's Q2 2026 core EPS surged 59% year-over-year to $1.54, driven by favorable regulatory outcomes.
- Full-year 2026 earnings guidance remains unchanged at $5.90 to $6.20 per share, reflecting confidence in ongoing grid and wildfire investments.
- Shares face short-term selling pressure despite medium- and long-term bullish signals, with key technical range set between $71.4 and $77.06 for the next five days.
Earnings surge meets persistent selling amid regulatory tailwinds
Edison International reported its second quarter 2026 earnings, revealing a 59% year-over-year increase in core earnings per share to $1.54. The company reaffirmed its full-year 2026 earnings guidance of $5.90 to $6.20 per share. Southern California Edison pointed to improved results from regulatory decisions, including the 2025 General Rate Case final decision, and ongoing wildfire mitigation and grid modernization initiatives, though price action has remained under broader selling pressure.
Supportive long-term trend amid diverging short-term momentum signals
EIX is trading below its 20-day moving average at $77.34 but remains above both the 50-day at $74.14 and the 200-day at $66.97, reflecting short-term downside momentum within a still supportive broader trend. Immediate technical levels show resistance at $76.71 and support at $74.43. Momentum indicators such as MACD and ADX point to a strong upward bias, while the RSI suggests a buy and the Stochastic RSI is in oversold territory. CCI and Awesome Oscillator remain neutral, and the Bull/Bear Power (BBP) value of 0.87 shows buyers still dominate intraday, despite an overbought signal. The sharp $3.93 drop included a 2.74% opening gap to the downside. Price is near today's session low, intraday volatility is 3.06%, and momentum readings are diverging, cautioning on near-term direction.
Earlier, analysts noted that Edison International was exhibiting strong bullish momentum supported by resilient technical trends. The recent break below the 20-day moving average signals increased near-term volatility, making $74.43 a key level for traders to monitor as the next direction unfolds.






Latest Edison International News



-
 Afghanistan
-
 Albania
-
 Algeria
-
 Angola
-
 Argentina
-
 Armenia
-
 Australia
-
 Austria
-
 Azerbaijan
-
 Bahamas
-
 Bahrain
-
 Bangladesh
-
 Belarus
-
 Belgium
-
 Bolivia
-
 Botswana
-
 Brazil
-
 Brunei
-
 Bulgaria
-
 Cambodia
-
 Cameroon
-
 Canada
-
 Chile
-
 China
-
 Colombia
-
 Congo
-
 Costa Rica
-
 Cote d'Ivoire
-
 Croatia
-
 Cuba
-
 Cyprus
-
 Czechia
-
 DR Congo
-
 Denmark
-
 Dominican Republic
-
 Ecuador
-
 Egypt
-
 El Salvador
-
 Estonia
-
 Eswatini
-
 Ethiopia
-
 Finland
-
 France
-
 Georgia
-
 Germany
-
 Ghana
-
 Greece
-
 Haiti
-
 Hong Kong
-
 Hungary
-
 India
-
 Indonesia
-
 Iran, Islamic republic
-
 Iraq
-
 Ireland
-
 Israel
-
 Italy
-
 Jamaica
-
 Japan
-
 Jordan
-
 Kazakhstan
-
 Kenya
-
 Korea
-
 Kuwait
-
 Kyrgyzstan
-
 Laos
-
 Latvia
-
 Lebanon
-
 Lesotho
-
 Libya
-
 Lithuania
-
 Luxembourg
-
 Madagascar
-
 Malaysia
-
 Malta
-
 Mauritius
-
 Mexico
-
 Moldova
-
 Mongolia
-
 Montenegro
-
 Morocco
-
 Mozambique
-
 Myanmar
-
 Namibia
-
 Nepal
-
 Netherlands
-
 New Zealand
-
 Nigeria
-
 North Macedonia
-
 Norway
-
 Oman
-
 Pakistan
-
 Palestine
-
 Panama
-
 Papua New Guinea
-
 Paraguay
-
 Peru
-
 Philippines
-
 Poland
-
 Portugal
-
 Puerto Rico
-
 Qatar
-
 Reunion
-
 Romania
-
 Rwanda
-
 Saudi Arabia
-
 Serbia
-
 Singapore
-
 Slovakia
-
 Slovenia
-
 Somalia
-
 South Africa
-
 Spain
-
 Sri Lanka
-
 Sweden
-
 Switzerland
-
 Syria
-
 Taiwan
-
 Tajikistan
-
 Tanzania
-
 Thailand
-
 Trinidad and Tobago
-
 Tunisia
-
 Turkey
-
 UAE
-
 Uganda
-
 Ukraine
-
 United Kingdom
-
United States
-
 Uruguay
-
 Uzbekistan
-
 Venezuela
-
 Vietnam
-
 Yemen
-
 Zambia
-
 Zimbabwe
- Forex
- Crypto












