

Support pressure seen: Can Nano Dimension stock hold the $1.45 level?

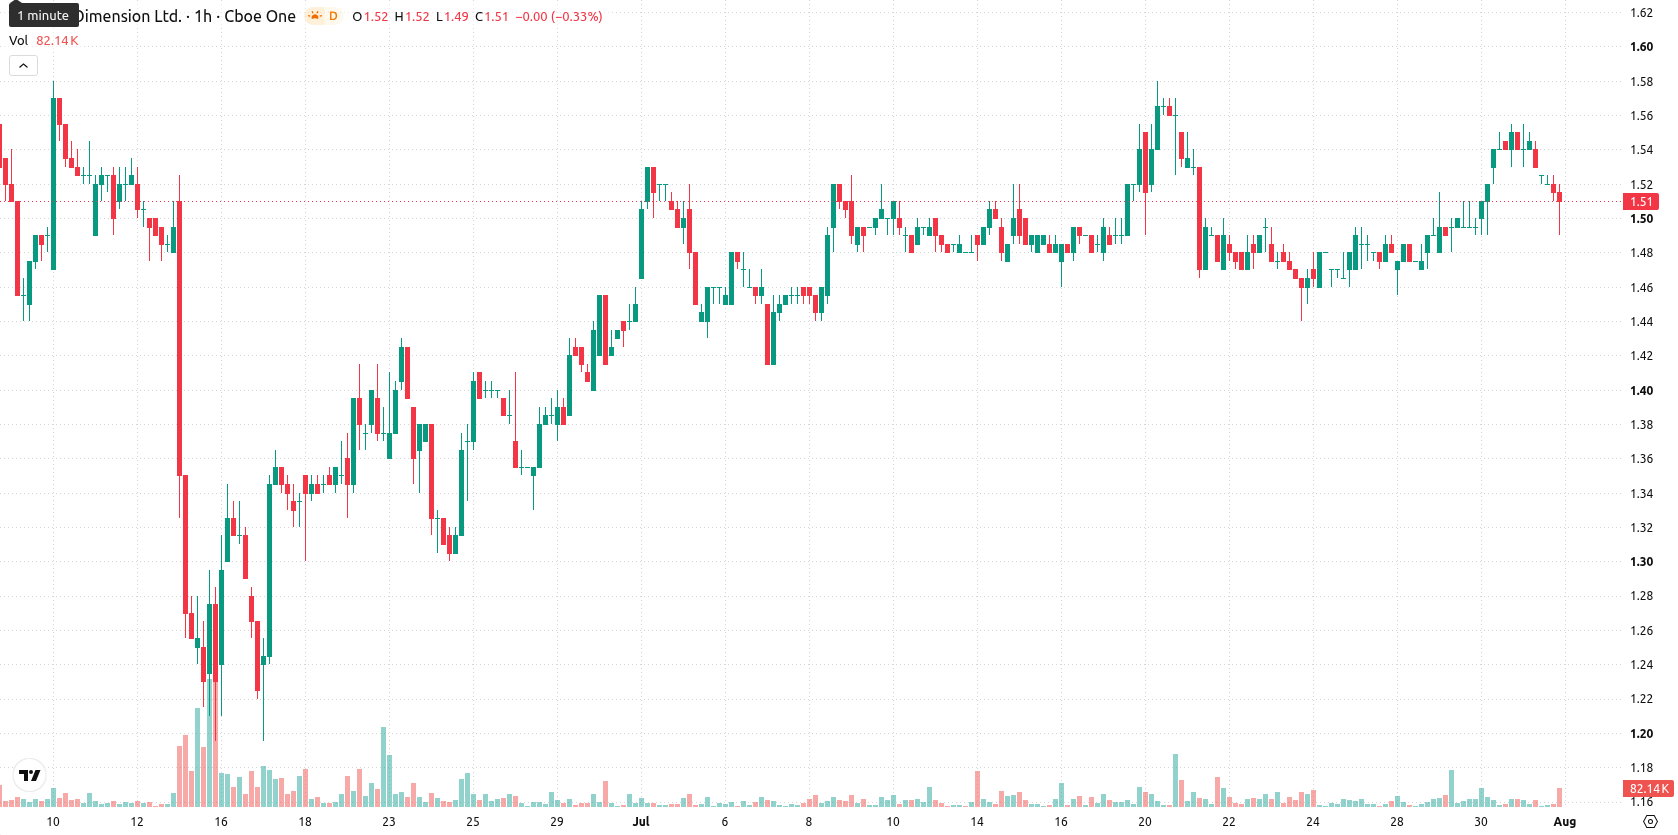
Nano Dimension (NNDM) stock is trading at $1.5, marking a daily decline of 2.6%. The price sits below its key moving averages.
 1.24
1.37
Highlights
- NNDM/USD trades below major long-term moving averages, indicating a persistent bearish trend despite some short-term buying interest.
- Oscillator signals are mixed, with most readings favoring sellers while MACD shows bullish divergence, highlighting momentum uncertainty.
- Price is projected to remain within the $1.45–$1.55 range in the next 2–3 days, with downside risk prevailing.
Bearish momentum diverges as price faces layered resistance
On the hourly chart, NNDM is trading below the MA-20 at $1.52 but above the MA-50 at $1.5, and it remains below the long-term MA-200 at $1.69. The Ichimoku Kijun sits at $1.52, currently acting as immediate resistance. Momentum readings show divergence: MACD signals a strong buy, whereas ADX is neutral. RSI reads 44.15, and CCI is in sell territory, reinforcing a bearish bias. Stochastic RSI is in oversold, Bull/Bear Power indicates sellers maintain dominance, and the Awesome Oscillator remains neutral.
Sideways trend likely as breakout triggers remain unconfirmed
Over the next 2–3 trading days, NNDM is projected to trade within the $1.45–$1.55 range. The probability of an upward move is 45%, with downside risk slightly higher at 55%. The baseline scenario is sideways movement in this volatility band. A break and hold above $1.52 would open a bullish scenario, while a drop below $1.45 would point to sustained selling.
Earlier, analysts noted that Nano Dimension was shifting from bearish momentum toward a more neutral-to-bullish technical stance as buyers showed renewed interest. However, the current technical picture reflects growing downside risk and fading bullish signals, making a break below $1.45 a critical level to watch for signs of sustained selling pressure in the days ahead.






Latest Nano Dimension News




-
 Afghanistan
-
 Albania
-
 Algeria
-
 Angola
-
 Argentina
-
 Armenia
-
 Australia
-
 Austria
-
 Azerbaijan
-
 Bahamas
-
 Bahrain
-
 Bangladesh
-
 Belarus
-
 Belgium
-
 Bolivia
-
 Botswana
-
 Brazil
-
 Brunei
-
 Bulgaria
-
 Cambodia
-
 Cameroon
-
 Canada
-
 Chile
-
 China
-
 Colombia
-
 Congo
-
 Costa Rica
-
 Cote d'Ivoire
-
 Croatia
-
 Cuba
-
 Cyprus
-
 Czechia
-
 DR Congo
-
 Denmark
-
 Dominican Republic
-
 Ecuador
-
 Egypt
-
 El Salvador
-
 Estonia
-
 Eswatini
-
 Ethiopia
-
 Finland
-
 France
-
 Georgia
-
 Germany
-
 Ghana
-
 Greece
-
 Haiti
-
 Hong Kong
-
 Hungary
-
 India
-
 Indonesia
-
 Iran, Islamic republic
-
 Iraq
-
 Ireland
-
 Israel
-
 Italy
-
 Jamaica
-
 Japan
-
 Jordan
-
 Kazakhstan
-
 Kenya
-
 Korea
-
 Kuwait
-
 Kyrgyzstan
-
 Laos
-
 Latvia
-
 Lebanon
-
 Lesotho
-
 Libya
-
 Lithuania
-
 Luxembourg
-
 Madagascar
-
 Malaysia
-
 Malta
-
 Mauritius
-
 Mexico
-
 Moldova
-
 Mongolia
-
 Montenegro
-
 Morocco
-
 Mozambique
-
 Myanmar
-
 Namibia
-
 Nepal
-
 Netherlands
-
 New Zealand
-
 Nigeria
-
 North Macedonia
-
 Norway
-
 Oman
-
 Pakistan
-
 Palestine
-
 Panama
-
 Papua New Guinea
-
 Paraguay
-
 Peru
-
 Philippines
-
 Poland
-
 Portugal
-
 Puerto Rico
-
 Qatar
-
 Reunion
-
 Romania
-
 Rwanda
-
 Saudi Arabia
-
 Serbia
-
 Singapore
-
 Slovakia
-
 Slovenia
-
 Somalia
-
 South Africa
-
 Spain
-
 Sri Lanka
-
 Sweden
-
 Switzerland
-
 Syria
-
 Taiwan
-
 Tajikistan
-
 Tanzania
-
 Thailand
-
 Trinidad and Tobago
-
 Tunisia
-
 Turkey
-
 UAE
-
 Uganda
-
 Ukraine
-
 United Kingdom
-
United States
-
 Uruguay
-
 Uzbekistan
-
 Venezuela
-
 Vietnam
-
 Yemen
-
 Zambia
-
 Zimbabwe
- Forex
- Crypto












